[User Guide] GTO Solver

![[User Guide] GTO Solver](/static/7f8110c804a1c0a04bd342d921fe6b36/ba17e/header.avif)
By using NTPoker, you can quickly and easily view GTO strategies. With this feature, you can check the game-theory optimal strategy for a variety of situations.

Table of Contents
Settings Screen
Basic Settings
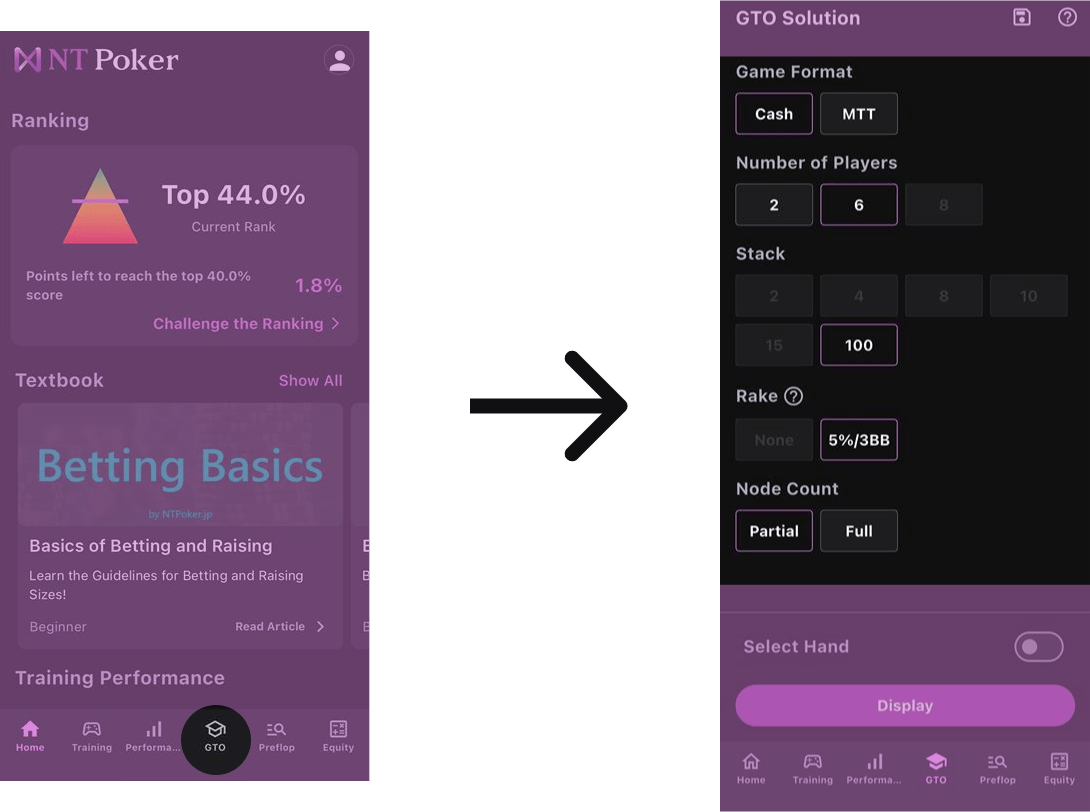
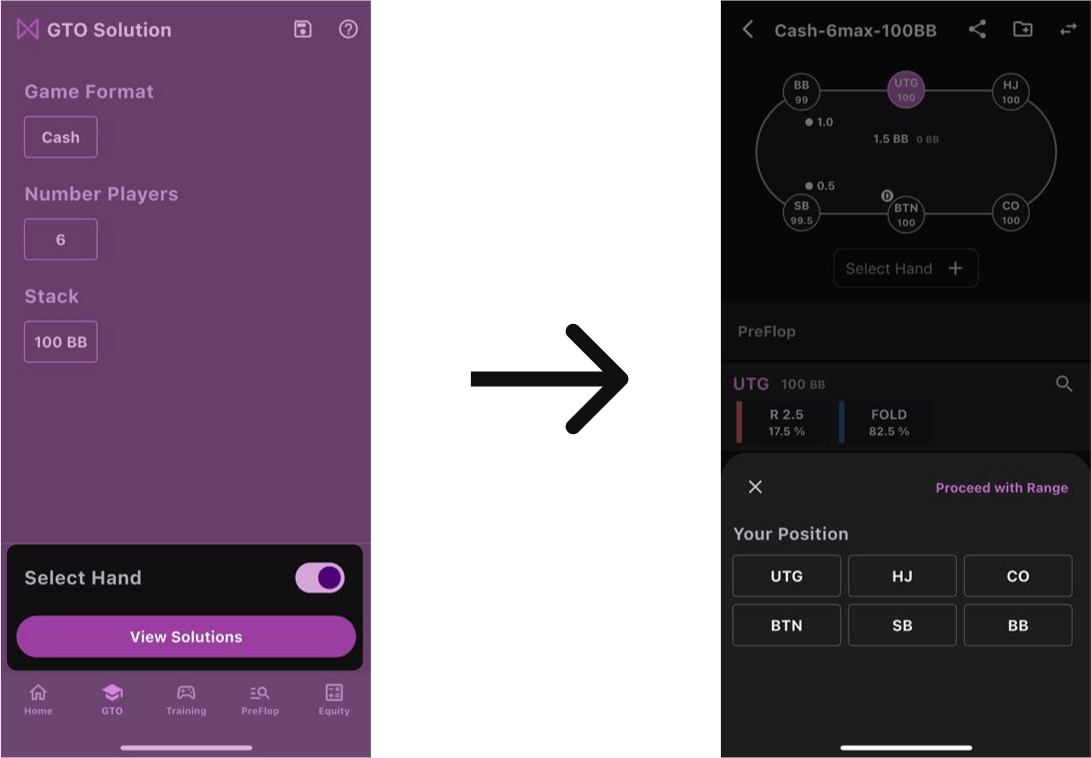
On this screen, you can configure the conditions for displaying GTO solutions. If the app is updated with additional solutions, more category options will appear.
You can check which solutions are available here.
Select Your Hand
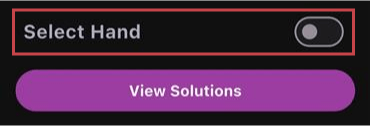
Turning this button ON allows you to specify your own hand to view the GTO strategy. Instead of using the Range Type screen, the solution will be displayed from the Action Type view. For more details on each view type, see here.
Load a Saved Solution
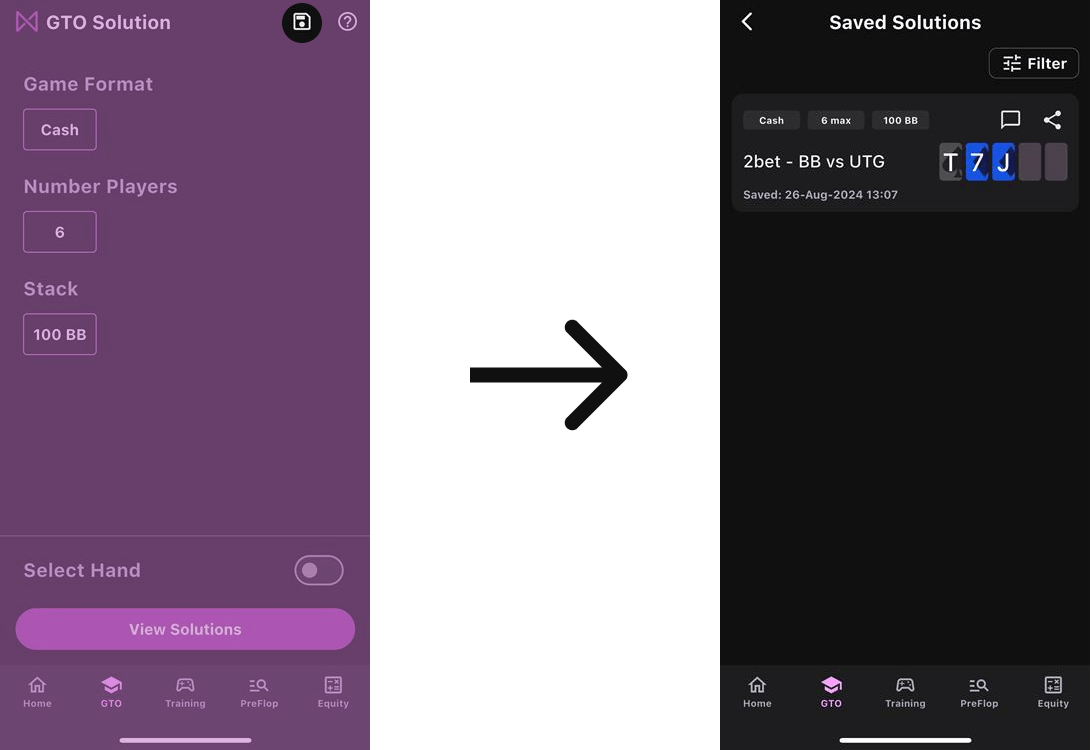
You can load previously saved solutions. For information on how to save solutions and related features, see here.
Viewing the Solution
You can view GTO strategies from two different UIs: a Range Type UI that focuses on viewing ranges, and an Action Type UI that focuses on selecting actions. During action progression, these two UIs are linked, enabling you to switch between them as needed.
For intermediate or advanced players who primarily analyze ranges, the Range Type UI is recommended. On the other hand, beginners or those new to poker might find the Action Type UI more helpful for getting a feel for action choices and decision-making. In the Action Type UI, you can specify your hand and proceed through actions.
Range Type
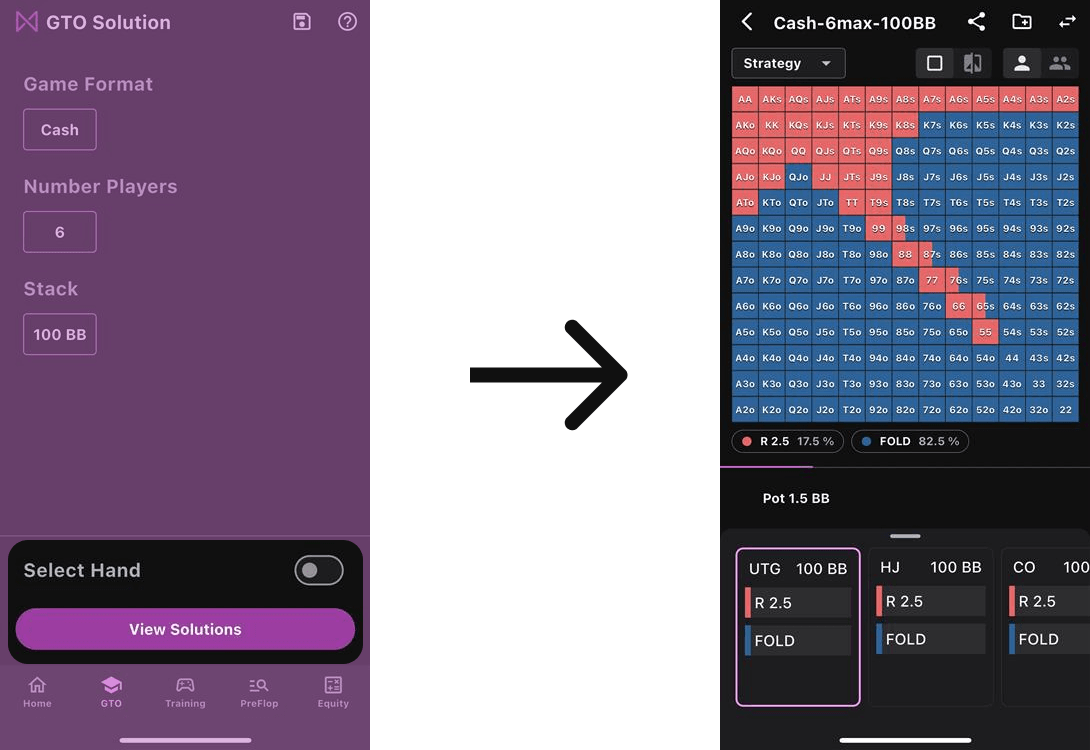
When the “Select Your Hand” switch is OFF in the settings screen, you can use the Range Type view. In Range Type, you can view a range chart for a specific situation.
Viewing Ranges
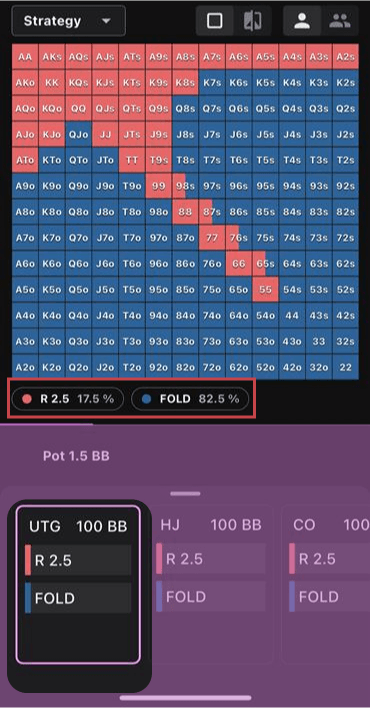
A range chart shows you the strategy and related information for each hand.
Each cell in the chart represents a specific group of hands. For suited hands, the cell represents 4 combinations; for offsuit hands, 12; and for pocket pairs, 6. For example, the AA cell includes AhAc, AhAd, AhAs, AcAd, AcAs, and AdAs.
By default, the strategy for that situation is displayed, letting you see how each group of hands is composed action-wise. The colors for each action are shown in the center of the screen.
The displayed range corresponds to the player framed in purple on the control panel.
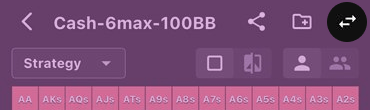
Switching Views
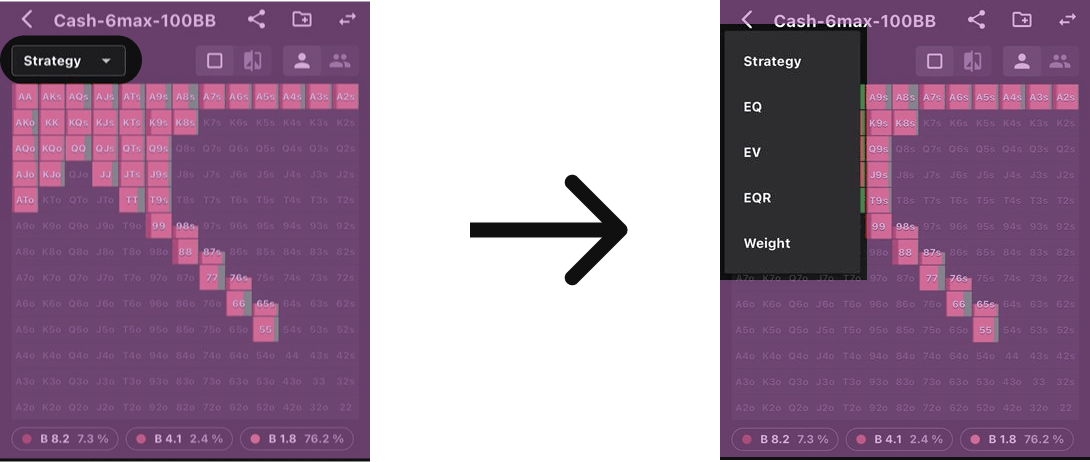
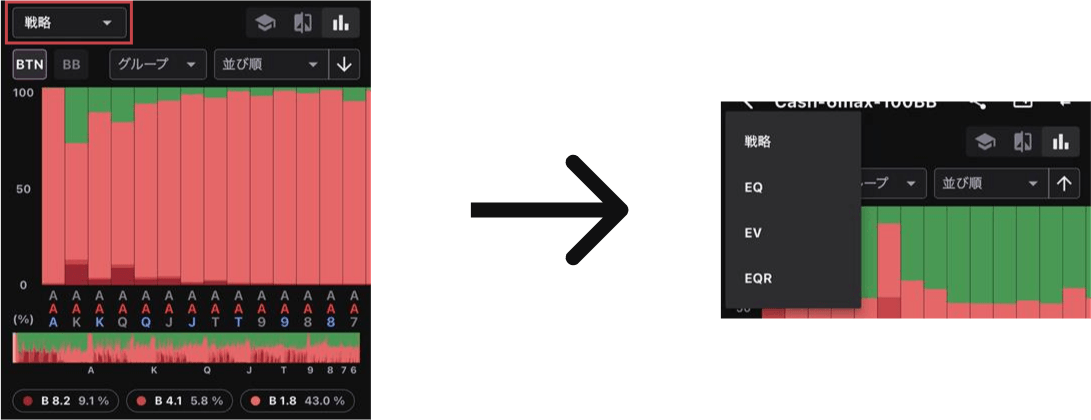
You can switch the displayed elements to any data you prefer. By default, Strategy is shown, but you can tap the dropdown to change it. In preflop scenarios, you can toggle between Strategy and Weight; in postflop scenarios, you can switch among Strategy, EQ, EV, EQR, and Weight.
| Display Element | Description |
|---|---|
|
| Shows actions in colors. The horizontal width indicates action frequency, and the vertical height indicates Weight. |
|
| Displays the percentage of remaining combos. |
|
| Shows the strength of equity. Green is higher, orange is lower. |
|
| Shows the strength of EV. Green is higher, orange is lower. EV is calculated per action, then averaged. |
|
| Shows the strength of EQR. Green is higher, orange is lower. |


Detailed Information
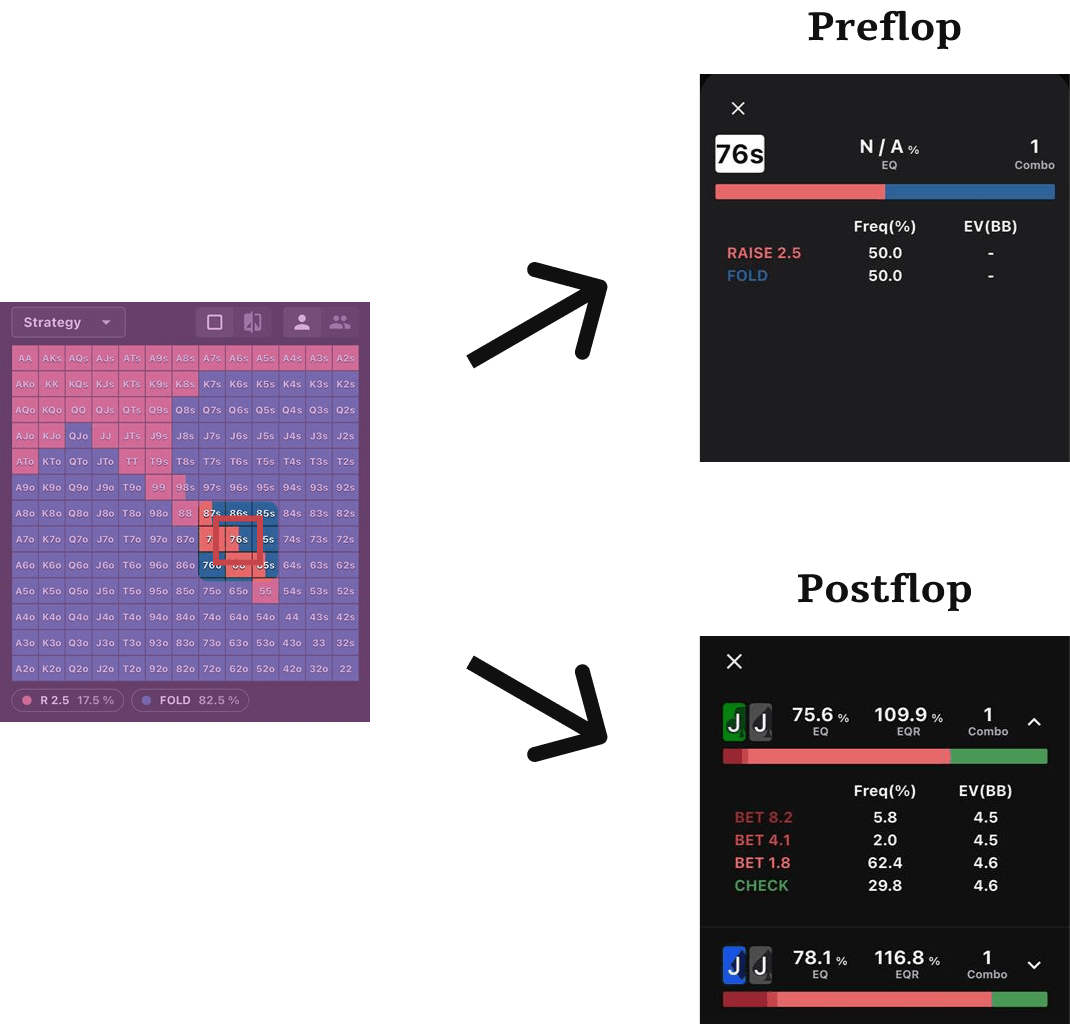
By tapping each cell in the range chart, you can view detailed information about that group of hands.
Preflop: There are no action differences based on suit within a group, so the display shows information by hand group rather than individual hands. This includes the selection frequency of each action, plus EV (if available). Postflop: Information is shown for each individual hand in the group, including action composition, EV, EQ, EQR, and the number of combos.
Filtering Actions
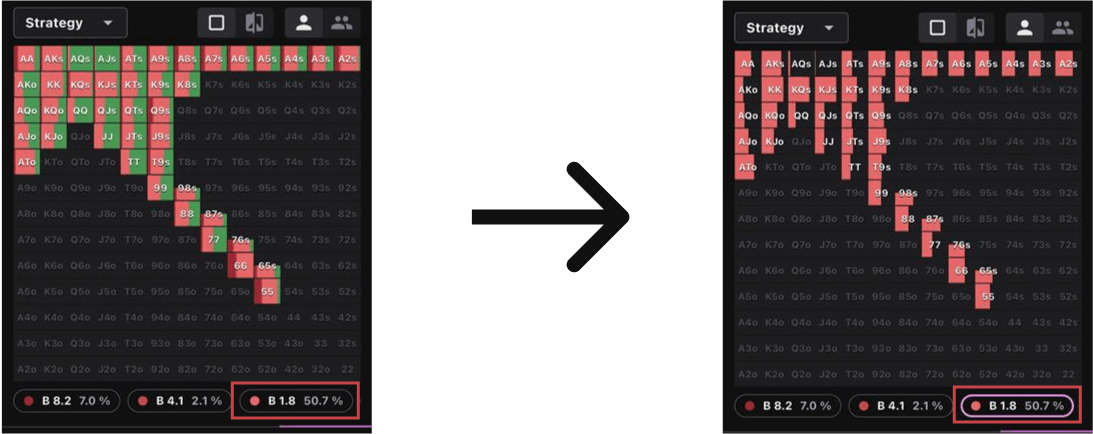
The displayed action frequency indicates how often that action is taken within the entire range.
By tapping a displayed action, you can filter the range chart to show only that action. This filter also affects the analysis information at the bottom of the screen. For more on analysis, see here.
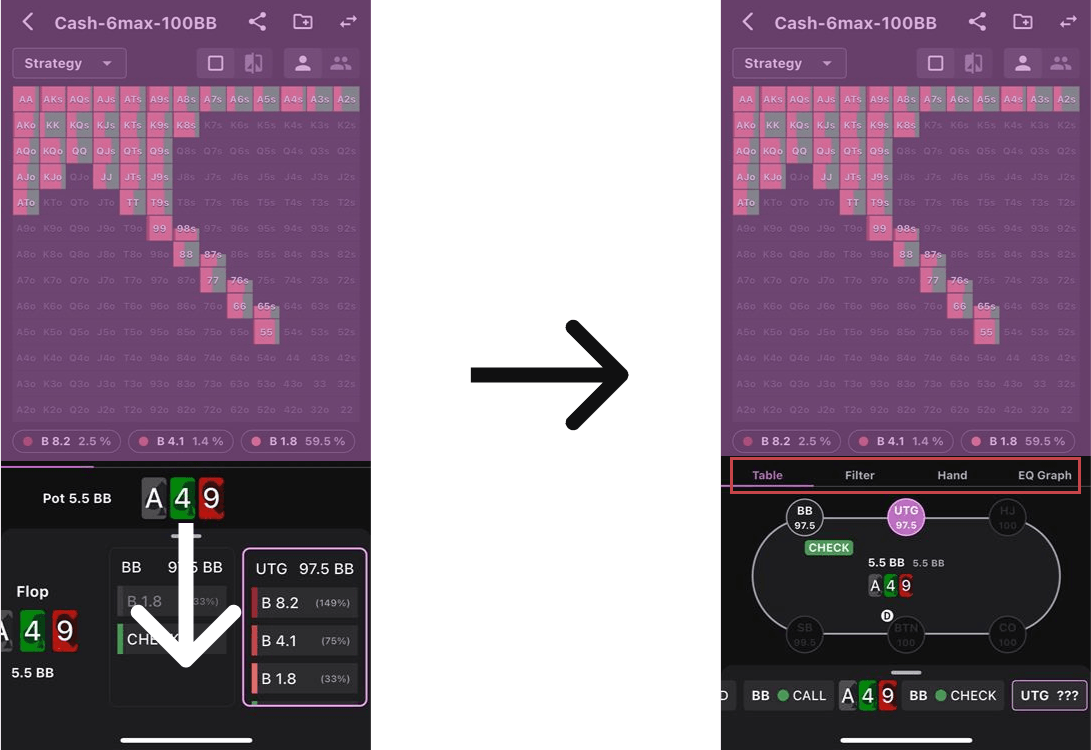
Action Selection
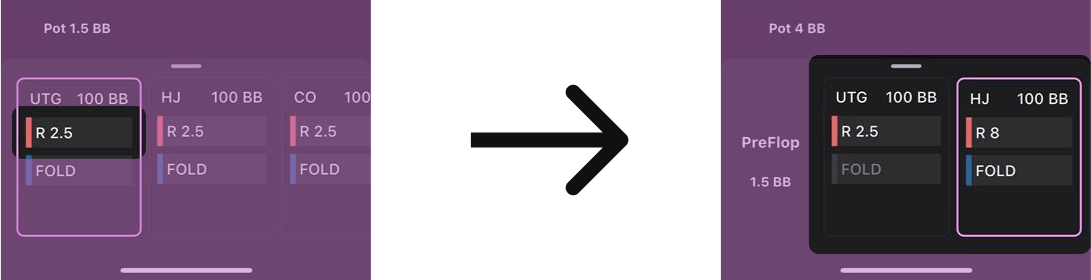
You can input player actions. The action choices are limited to those with a non-zero frequency in the GTO strategy. If an action is entered for a player, any players earlier in the action order who have not acted are treated as having folded. Once each round of actions finishes, the screen automatically transitions to the board selection screen (for more on board selection, see here).
If there is no range data for the situation in the solution you are viewing, the input action is skipped and treated as a fold. For example, in a 2-way solution, once the second player’s action is entered, any subsequent players are skipped.
If you change a previously selected action to a different one, all subsequent actions are reset. By tapping the position of a past player, you can view the range without changing its action choice.
You can collapse the operation panel by sliding it down. When collapsed, you can only change the node. Slide it up to uncollapse.
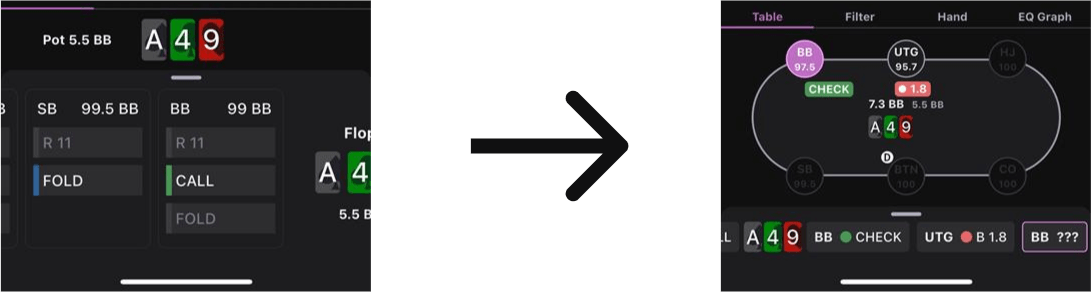
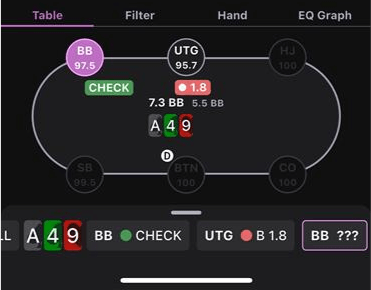
Board Selection
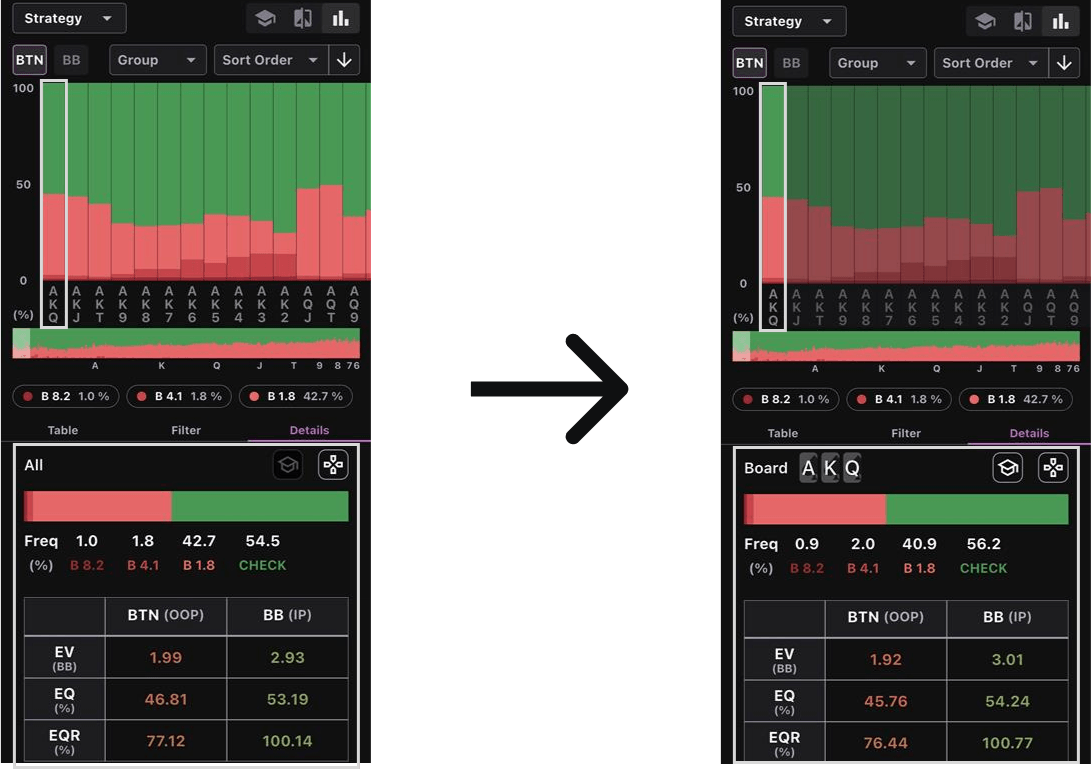
Once an action ends a round, you transition to the board selection screen. After selecting a board, you can change it by tapping the board section of the action panel.
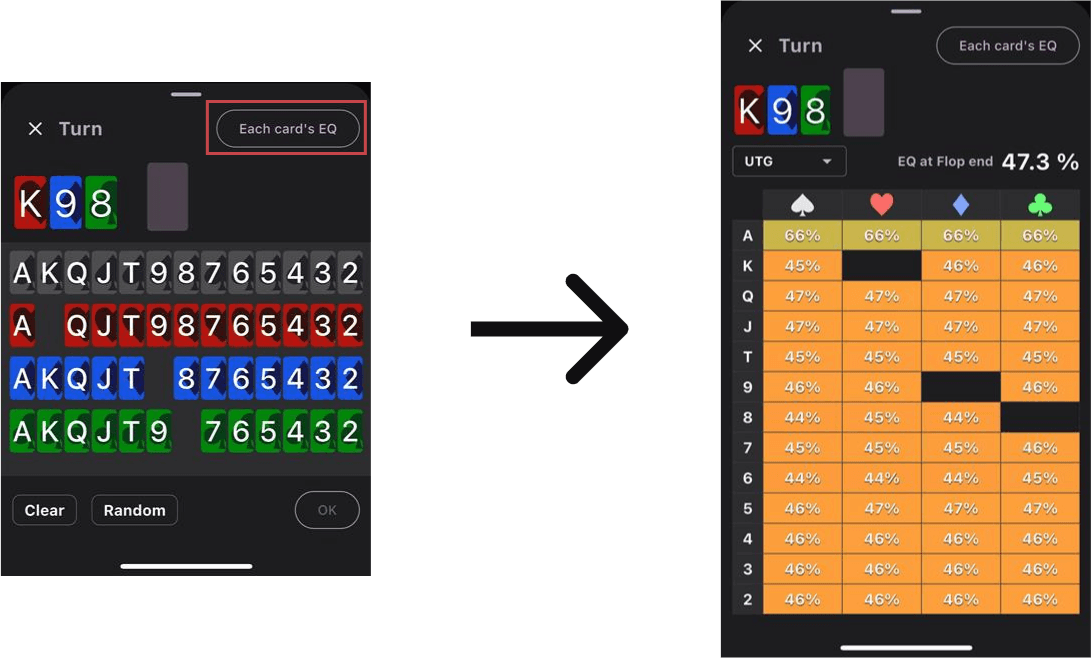
From the turn onward, tapping the “各カードのEQ” button (“EQ for Each Card”) lets you view the equity if each card appears on the board. You can also tap a relevant cell to select a board card. Additionally, you can use the dropdown to change which position’s equity is displayed.
Hand Type
When the “Select Your Hand” switch is ON in the settings, you can use the Hand Type view.
Hand and Position Settings
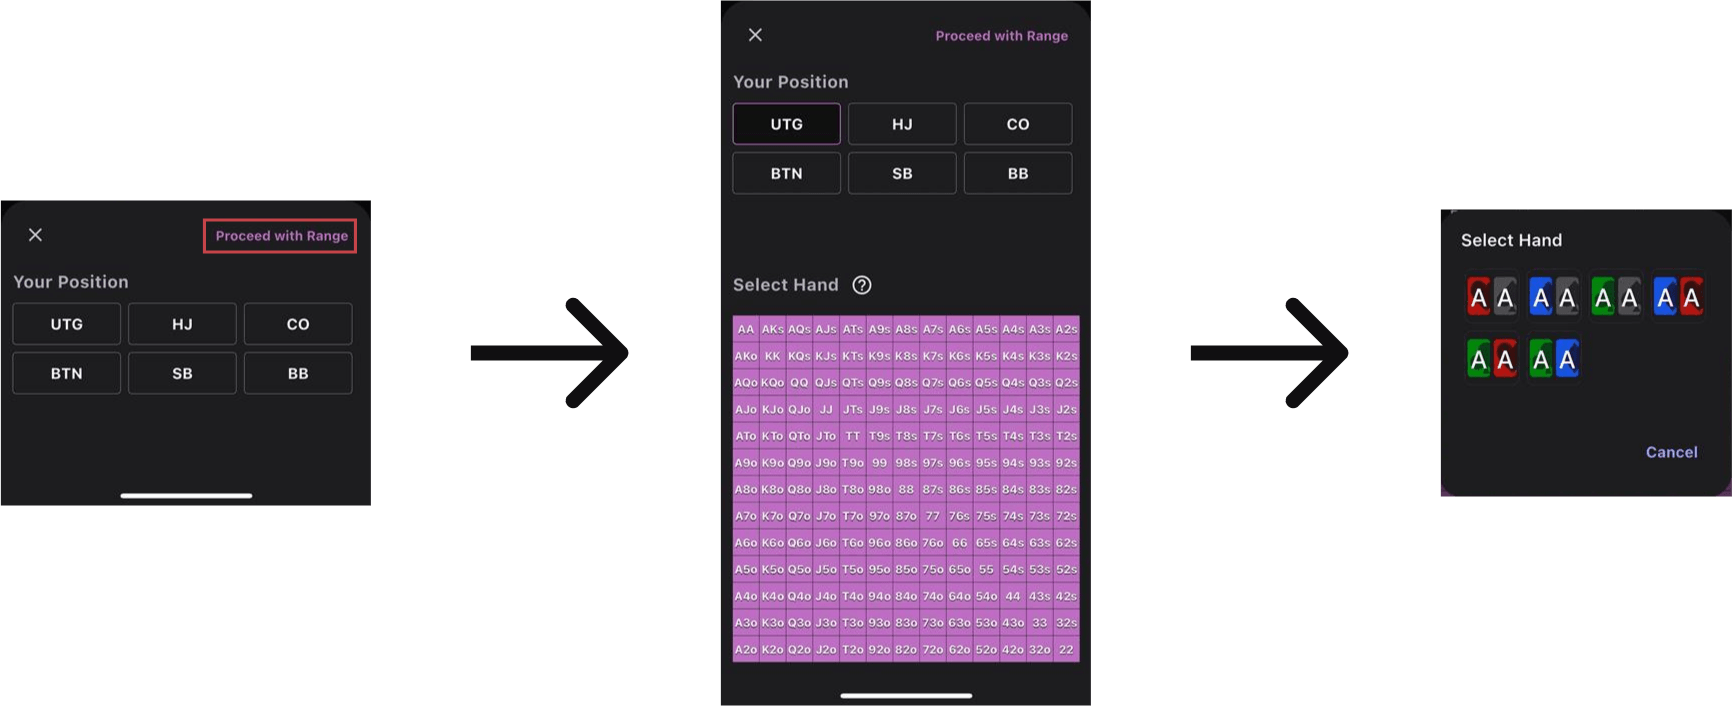
You can select your position and hand. When you choose a position, a table of selectable hand groups appears. Tapping a cell in that table allows you to select individual hands within that group. Alternatively, tapping the “レンジで進める” (“Proceed with Range”) button in the top-right lets you continue without specifying a hand.
Changing Hand and Position
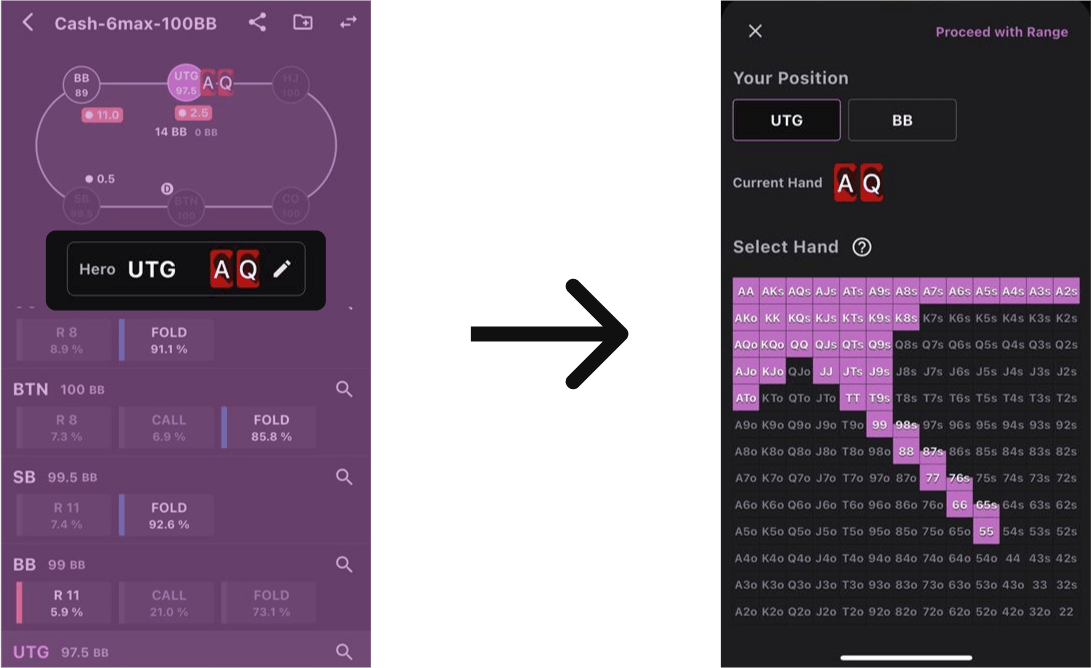
By tapping the frame showing your hand and position, you can change them. Only an active player’s position can be selected, and only hands that are still possible based on the previously chosen actions (i.e., included in your range) are shown.
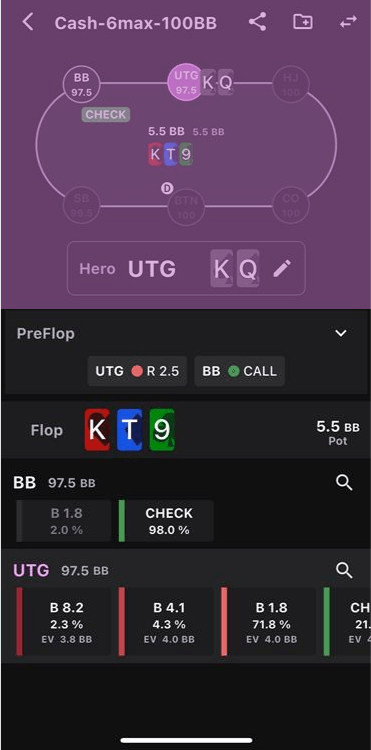
Game Status
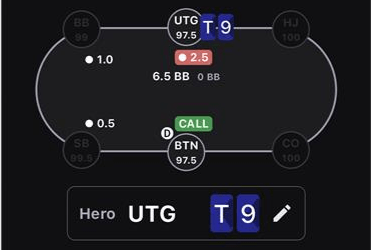
A table at the top of the screen shows the current game situation. As actions progress, the table’s information updates accordingly.
Action Selection
Tapping an action choice selects that action and continues the game. You can also re-select a different action if you previously chose another. If an action is changed, all subsequent actions are reset.
To check the game situation at a previously selected action, tap the corresponding position.
Once the preflop round concludes, its details are collapsed. You can still view the action transitions in collapsed form, but tapping the downward arrow icon displays more detailed preflop actions.
About Action Choices
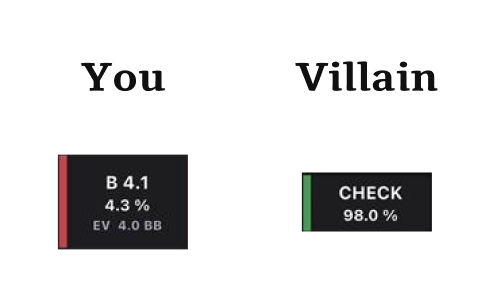
From top to bottom, each action choice shows the action, its frequency, and its EV. EV is displayed only if a specific hand is set. If a hand is set, the action frequencies and EV correspond to that hand; if not, the values reflect the overall range.
Viewing the Range Chart
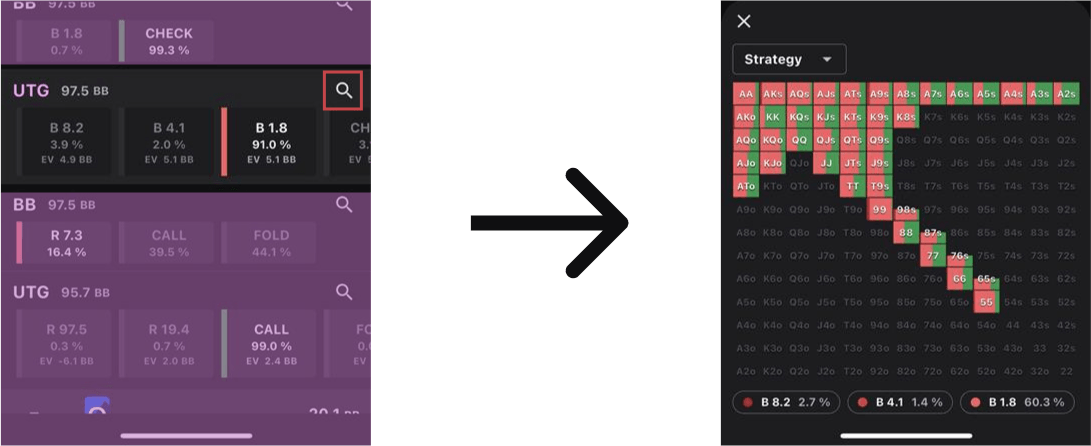
By tapping the magnifying-glass icon next to the position, you can see the range chart for that situation. You can also change the displayed information from the dropdown menu.
Feedback
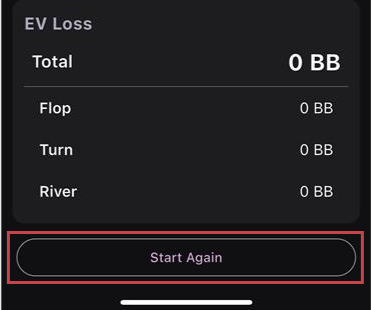
Based on the chosen action, you can check the EV loss for each round and the total EV loss.
Tapping the “初めから” (“Start Over”) button resets all actions and returns you to the initial state (UTG’s preflop action).
Analysis Features
You can view four types of analysis information from the middle tab on the right-side image. If the operation panel is raised, you’ll only see basic info; sliding it down reveals more detailed analysis data. You can switch among these analysis views by changing tabs or swiping horizontally.
Table
In the Table tab, you can check the overall game situation. You cannot interact with this table. It displays the range for the player highlighted in purple.
Filter
The Filter tab categorizes the groups of hands in the range by various elements, and shows the percentage those elements occupy within the entire range, and their action compositions.
You can choose Role, Draw, or EQ classification axes.
Based on the chosen axis, the range’s hands are grouped by each element. For example, if you choose Role and a hand is categorized as “one pair” or “high card,” it will appear under that category.
The action compositions of each grouped element are arranged horizontally, and the vertical axis corresponds to each hand’s strategy distribution (similar to the Strategy portion in the Hands tab).
By reviewing these details, you can objectively analyze the structure of the range and strategic trends.
Switching Displays
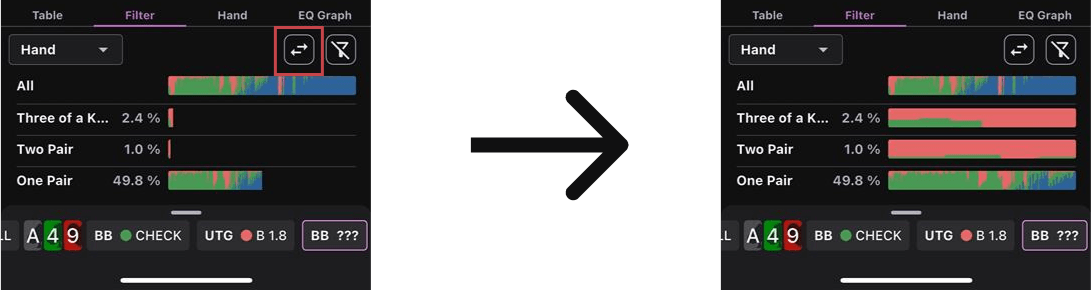
By default, the gauge for action composition reflects the percentage of combos each element represents in the entire range. For instance, if one pair makes up 49.8% of the overall range, the gauge for one pair will be about half its width (49.8/100). If you switch the display mode, these gauges can be expanded to their maximum width.
Filtering the Range
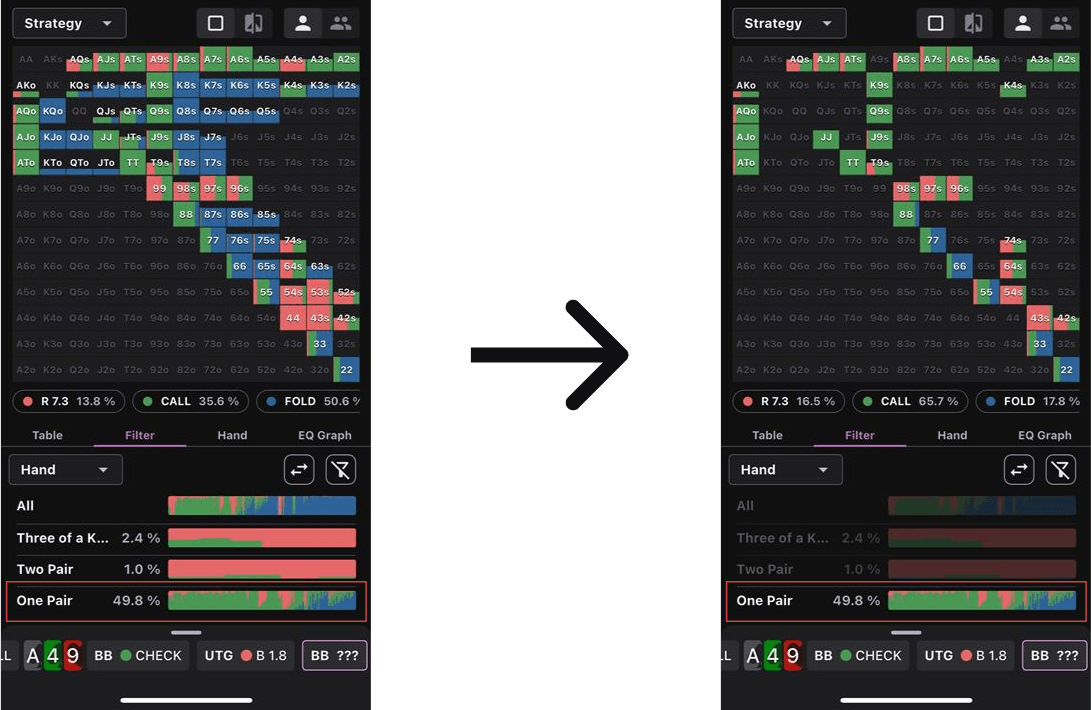
By tapping each element, you can narrow down the displayed information to that element. You can select multiple elements at once. Both the analysis information and the range display are subject to these filters. Tapping “フィルター解除” (“Clear Filter”) removes all filters. Your chosen filters remain active even if you switch tabs.
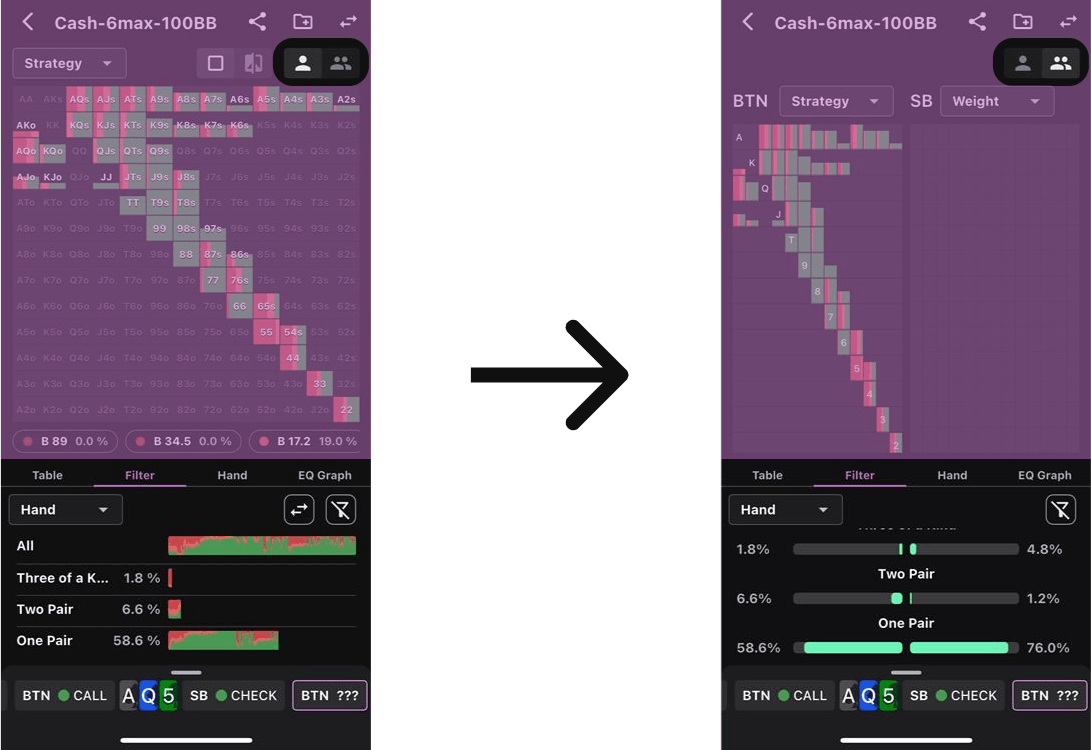 If you set the number of players at the top of the screen to 2, you can compare both players. You can see how each element’s hand percentage differs between the two. As with a single-player view, tap an element to apply a filter for that element.
Hands
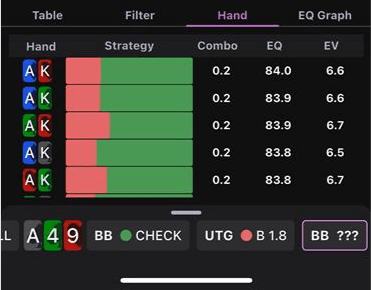
You can view detailed information for each hand in a list. Hands are sorted from the highest EQ to the lowest, and you can see each hand’s action composition, number of combos, EQ, and EV. For example, in the figure, 9s9c raises about 60% of the time and calls about 40%.
EQ Graph
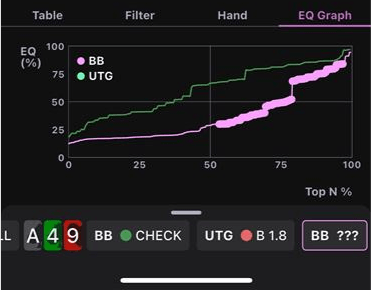
You can compare the EQ of each player’s range. The x-axis lists each hand in ascending order of EQ, while the y-axis shows each hand’s EQ. Displaying this for both players lets you compare each player’s range EQ relatively.
Set Analysis
By using the Set Analysis feature, you can grasp how strategies differ on various boards. You can simultaneously check what actions are taken across multiple boards, such as paired boards, wet vs. dry boards, low boards, etc., under different conditions.
As of ennuary 2025, the Set Analysis feature does not apply to every situation; it is only available for certain limited scenarios.
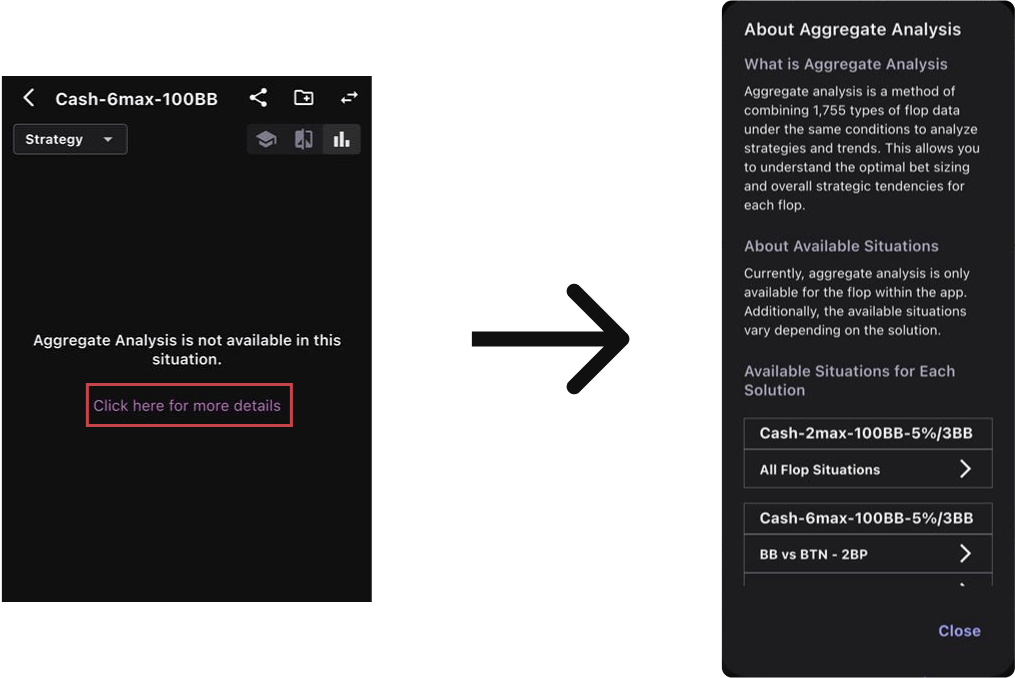
To see which scenarios support Set Analysis, tap (“Learn More”) when the feature is unavailable.
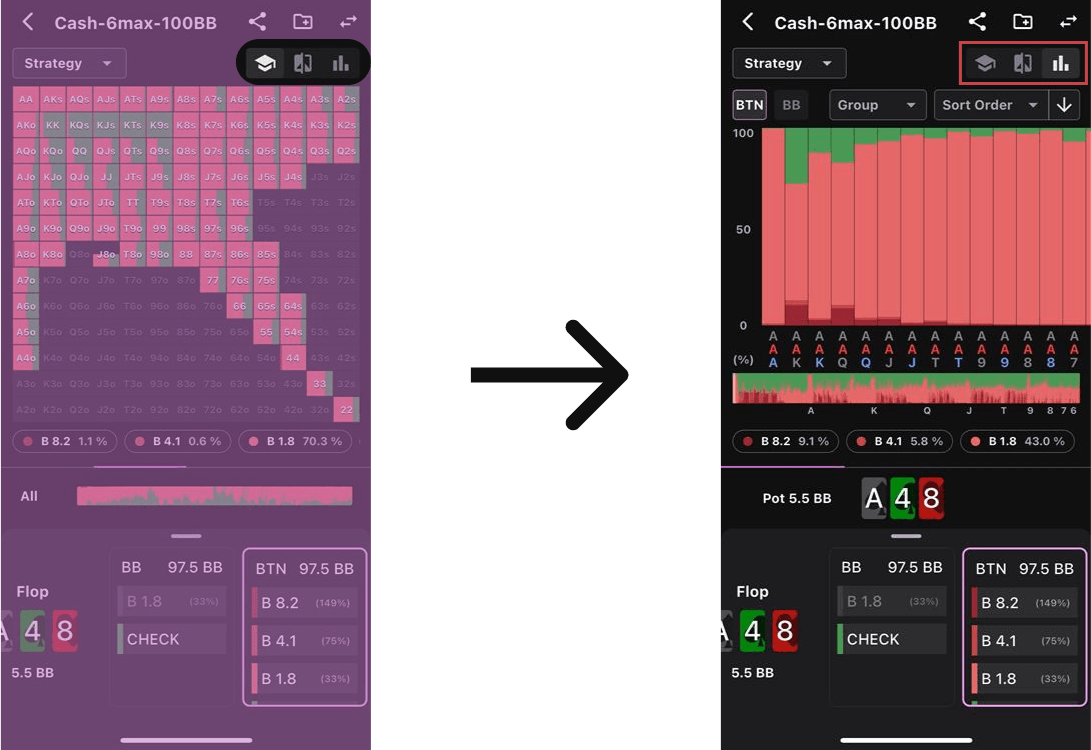
Screen Overview
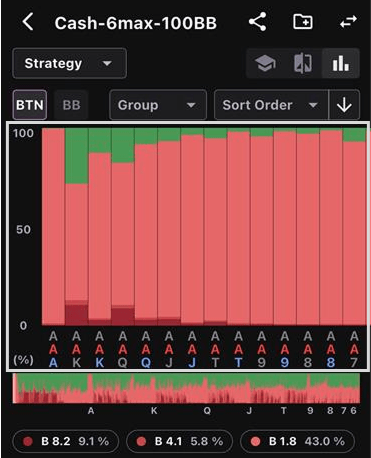
Here, you can check the action composition ratio for the entire range on each board. The colors displayed around the middle of the screen indicate each action’s share on that board.
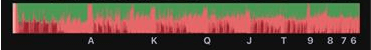
This shows a list of all boards (or display units if you’ve changed the display), and you can tap a board to jump to its details.
Filtering
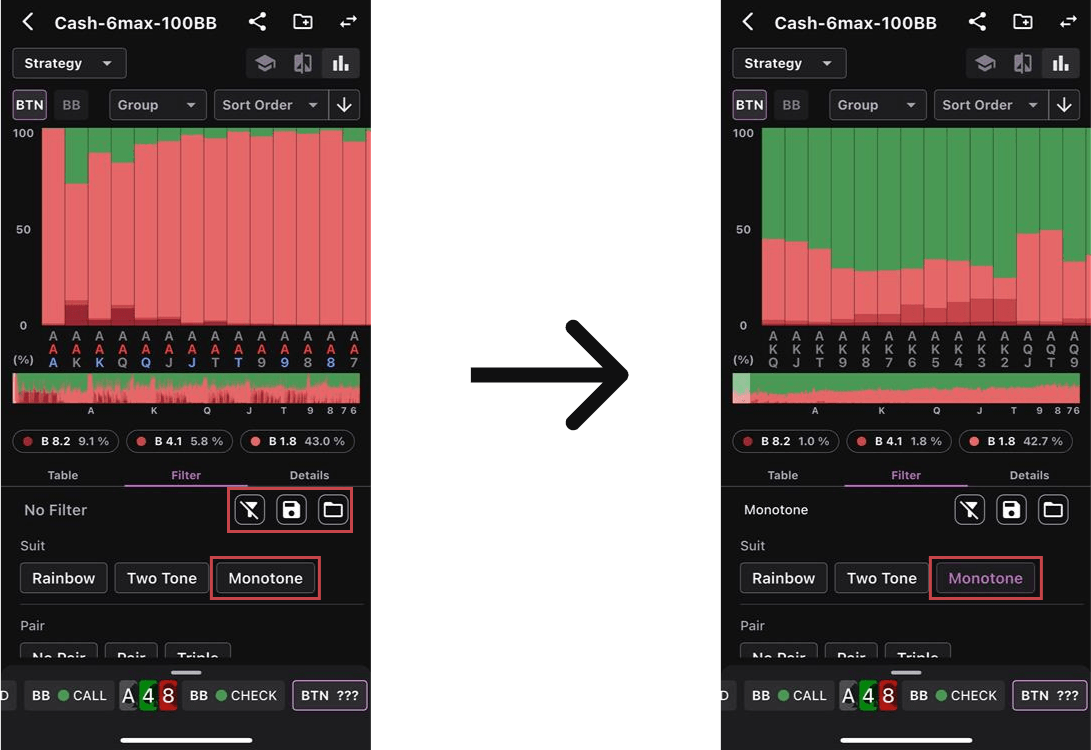
You can select filtering conditions for the boards you want to include in Set Analysis. Only boards meeting your chosen conditions will appear. You can also save these filtering conditions and load them later to view the same subset again.
Detailed Information
You can check more detailed numeric data. If you specify a board, that board’s stats are shown; if not, you see aggregated data for all boards. You can view each position’s EV, EQ, and EQR.
Additionally, tapping each icon lets you go to a training screen or the GTO viewer. If you specify a board, you train on that board; if not, you train on a random board.
Changing Display Information
Switching the Display
You can choose to display Strategy, EQ, EV, or EQR from the dropdown.
Switching Positions
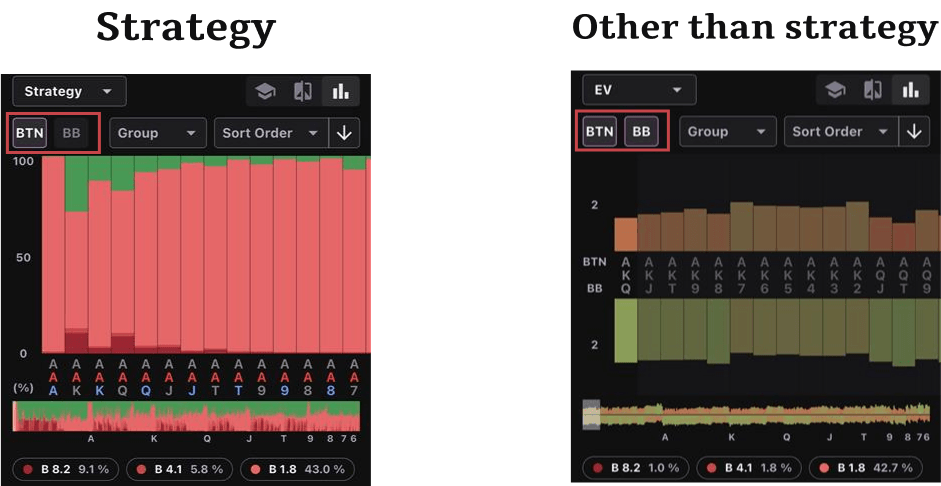
By tapping the position area, you can choose which position’s data to view in Set Analysis. If displaying EQ, EV, or EQR, you can show data for both players at once.
Grouping
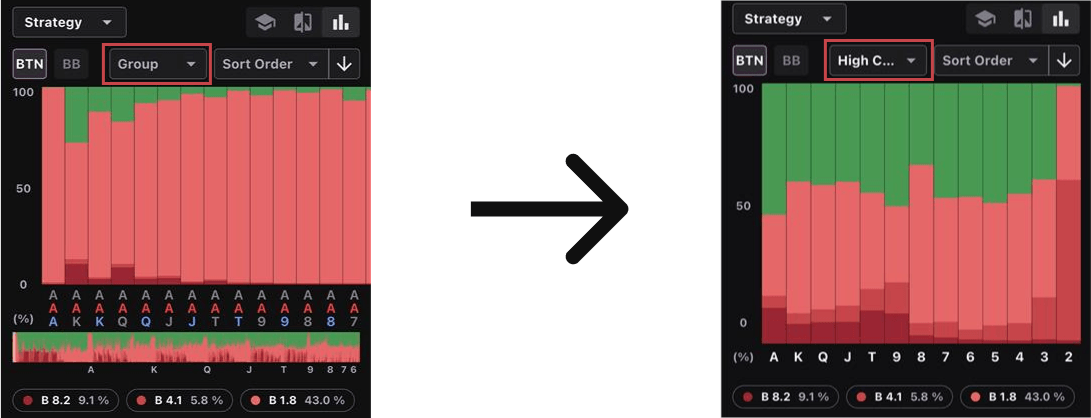
Set Analysis can group boards according to a selected aggregation method. By default, all boards are displayed, but by choosing an option from the Group menu, you can cluster boards based on that choice. For example, picking “High Card” groups boards from Ace-high down to 2-high, aggregating all boards in each category.
Order of Display
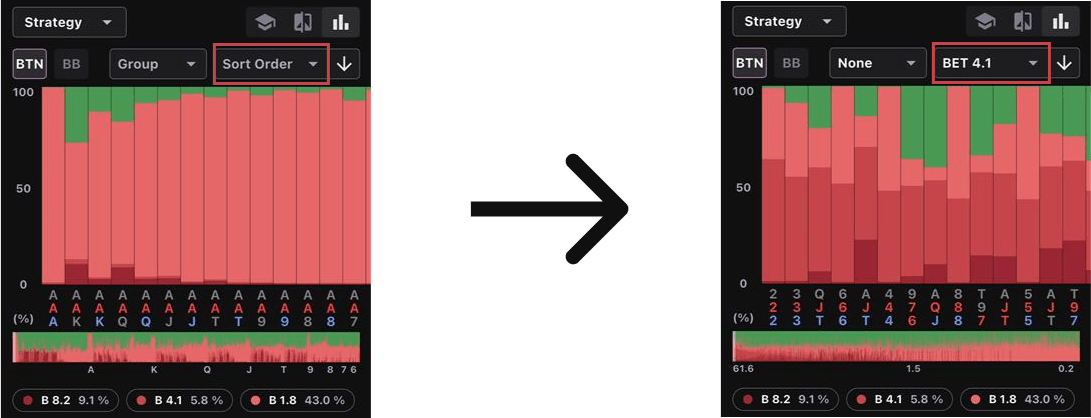
You can change how boards are ordered—for example, based on action frequency, EV, or EQ for each position.
Switching the Order of Display
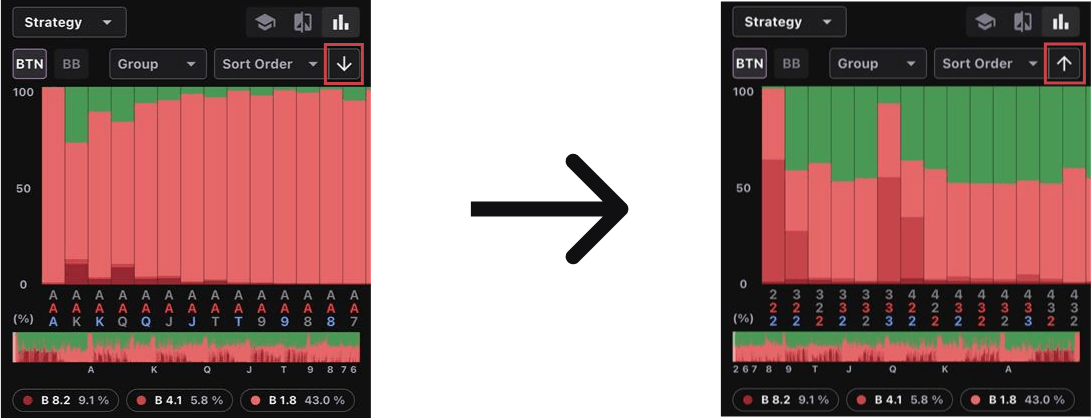
When the arrow points up, boards are listed in ascending order from left to right; when it points down, they are in descending order.
Saving Solutions
Saving
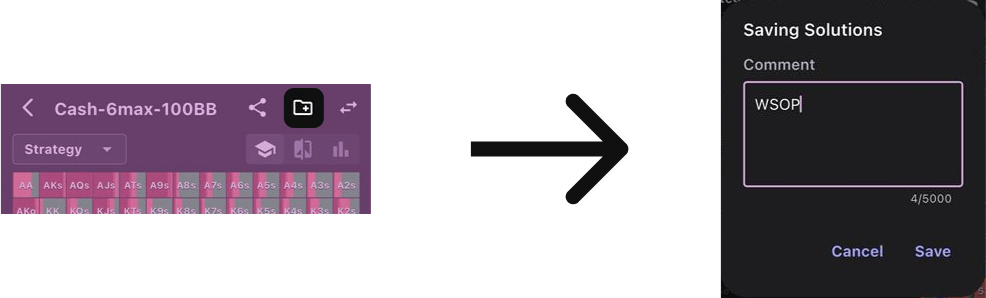
You can save a specific situation for future review.
When saving, you can leave a comment to record what discoveries or learnings you gained. You can edit saved comments from the Saved Solutions section in the settings.
Sharing
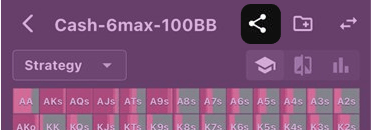
You can share saved solutions. Copy the link to your clipboard and share via any tool you like. Ensure the recipient has the NTPoker app installed, and remember to use your default browser when opening the link.
Filtering
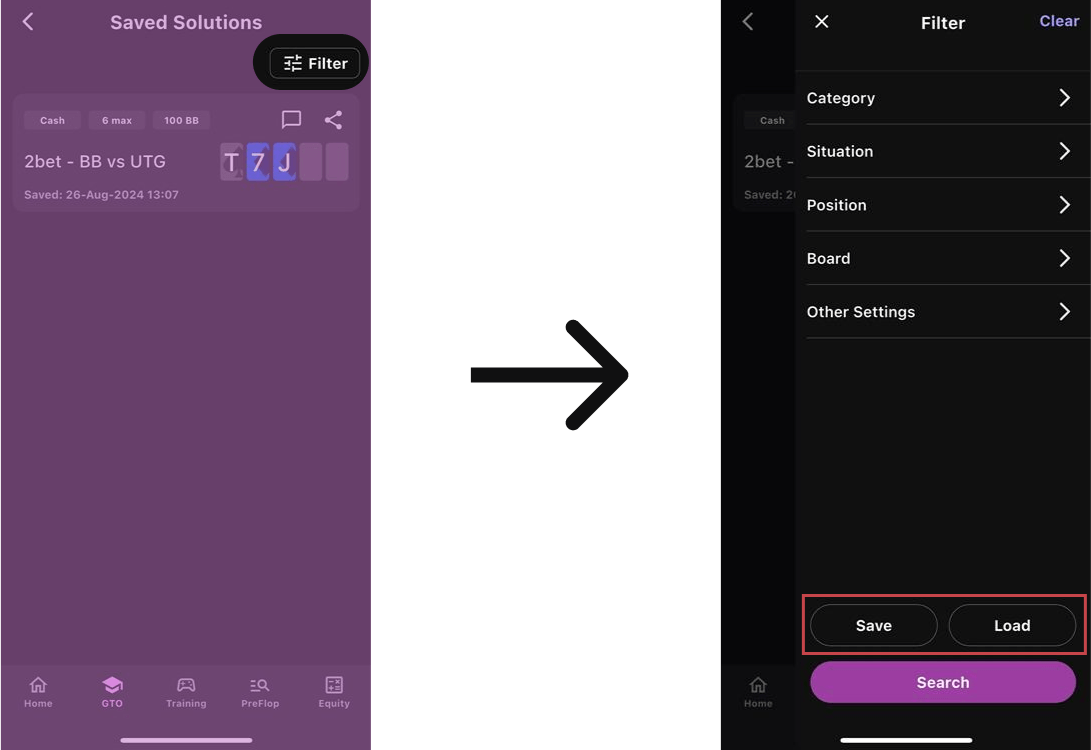
You can filter your saved solutions. You can save these filter conditions with the “Save” button and load them with the “Load” button. Frequently used conditions can be saved to avoid reconfiguring them each time.
Deleting
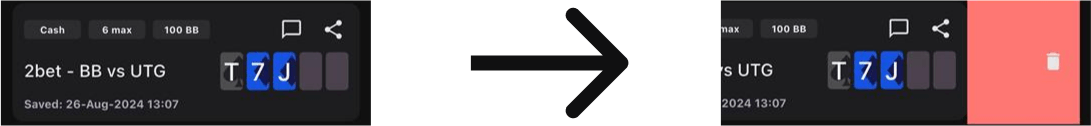
Saved solutions can be deleted by sliding the relevant solution horizontally in the list view.