[User Guide] Grade Management

![[User Guide] Grade Management](/static/d5e048a2bf6e8f602eff99102172dc42/ba17e/header.avif)
With this feature, you can filter the results of your training from various perspectives such as actions and situations, and analyze the scenarios you struggle with. Make use of this feature to identify your weaknesses and improve them.
Table of Contents
Home Screen
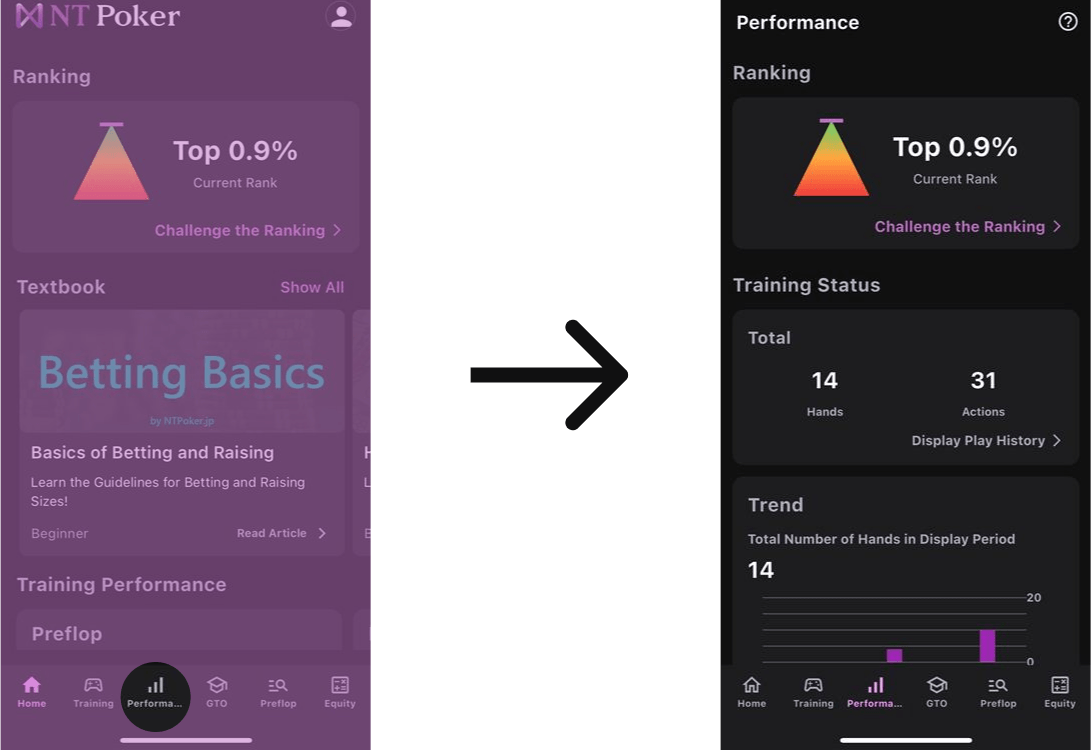
From the Home Screen, you can navigate to various other screens.
Ranking Play
Overview
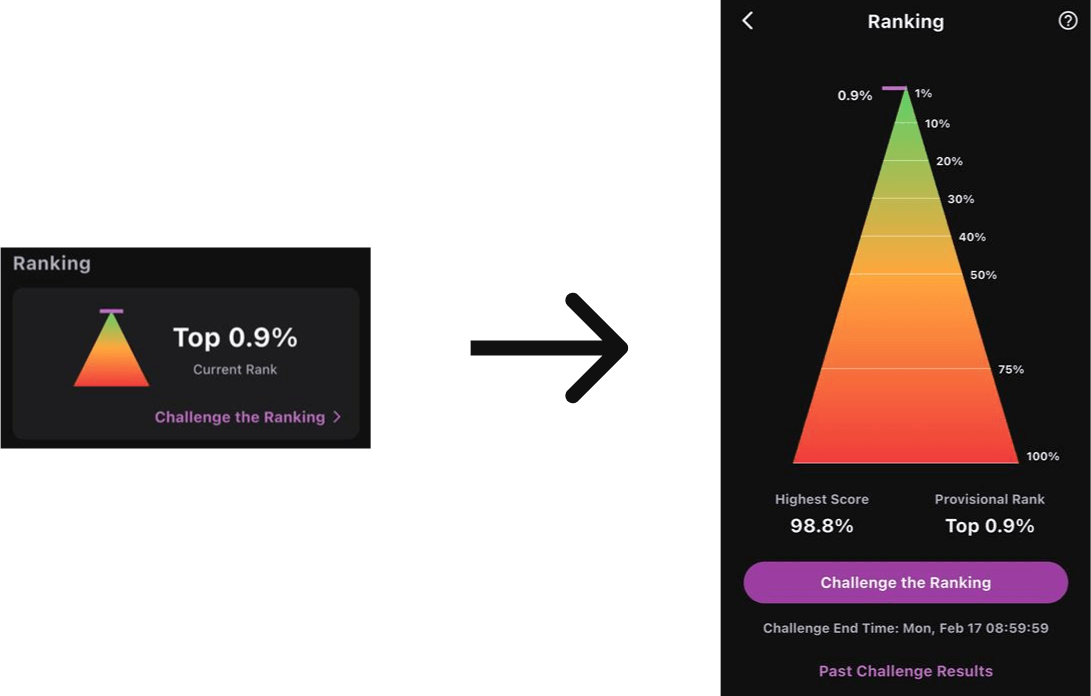
You can compete against other users in terms of your training results. You will play 10 hands, and your ranking is based on the total score from those 10 hands.
Schedule
Rankings are updated weekly.
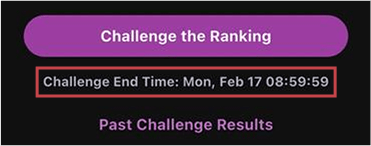
In the ranking screen, you can see your best weekly rank and the corresponding score for that challenge. “End time” indicates when the current ranking attempt closes, with the final time taken from the moment the challenge ends. The deadline is Monday at 0:00 (UTC).
Past Challenge Results
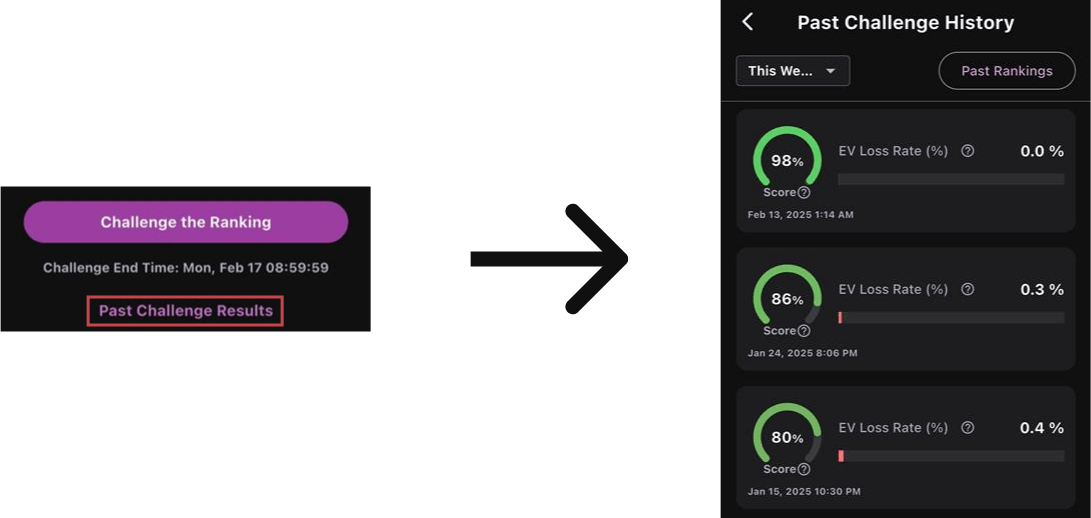
From Past Challenge Results, you can view a list of your previous attempts. By tapping each card, you can check the 10-hand history from that challenge.
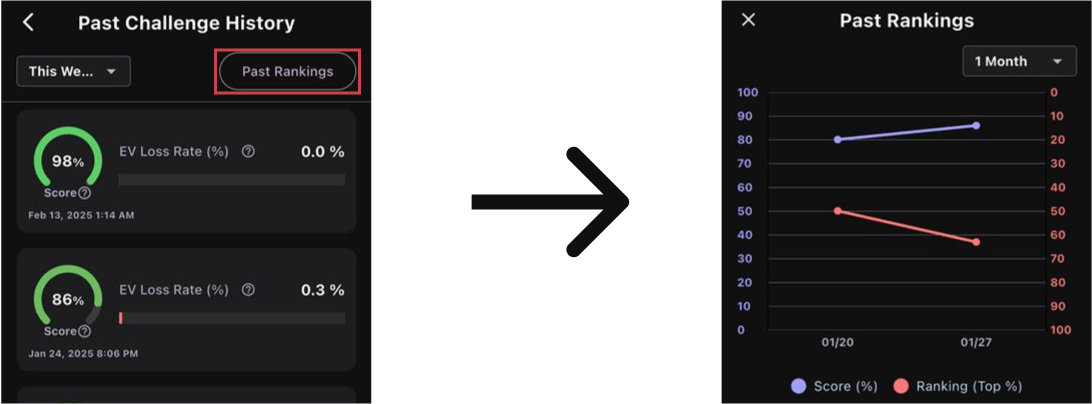
You can also see past rankings and the transition of your scores over time.
Ranking Play
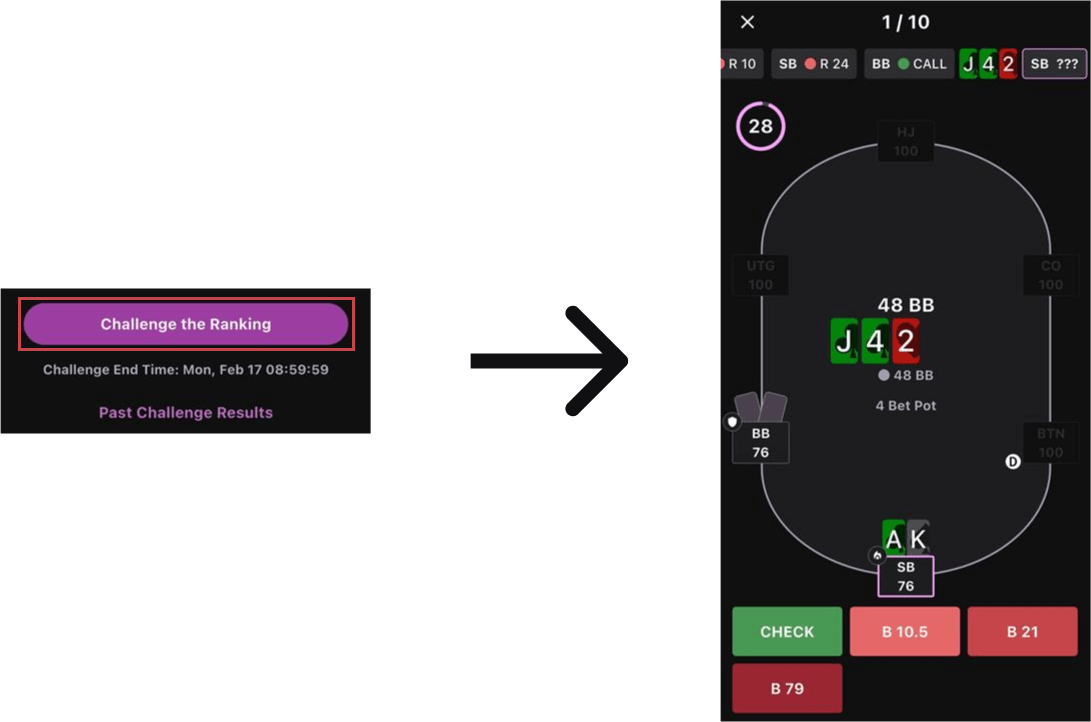
Your ranking is determined based on the total of the scores for each selected action. There is a 30-second time limit per action. If you exceed the time limit, you automatically fold. If you choose an action with a 0% frequency according to GTO, that hand immediately ends. If you do not complete all 10 hands or stop midway, that attempt will not be reflected in the ranking.
Training Status
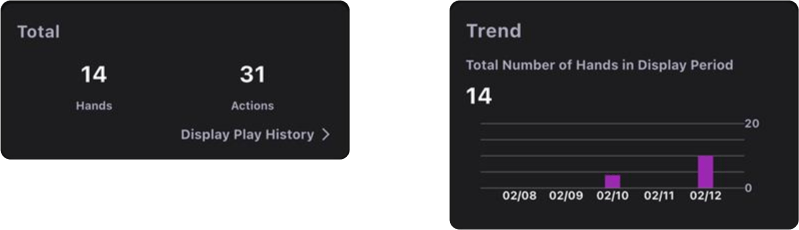
In Training Status, you can view the total number of hands and actions you’ve played in training. In “Trends,” you can see how many hands you’ve trained over a certain period. By tapping “View Play History,” you can see detailed history information. For details on the play history, see here.
Training Analysis
From Training Analysis, you can transition to Preflop, Postflop, or other performance management screens. For more information on performance management, see here.
Recommended for You
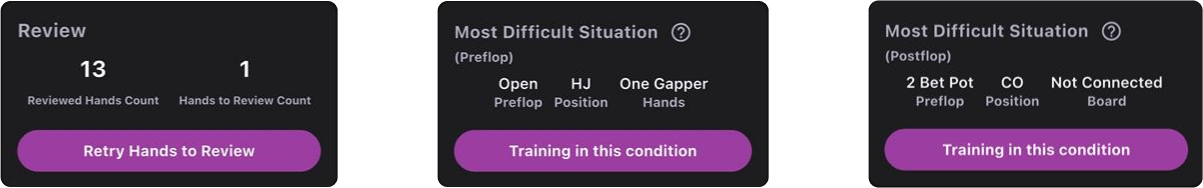
In the Recommended section, you can navigate to “Hands Requiring Review” and “Your Most Challenging Situations.”
- Hands Requiring Review
You can see a list of training histories needing review (hands where you chose actions with a score of 60% or less). You can retrain those hands again. - Your Most Challenging Situations
Here, you automatically set training conditions for scenarios with particularly low scores and practice them.
Training History
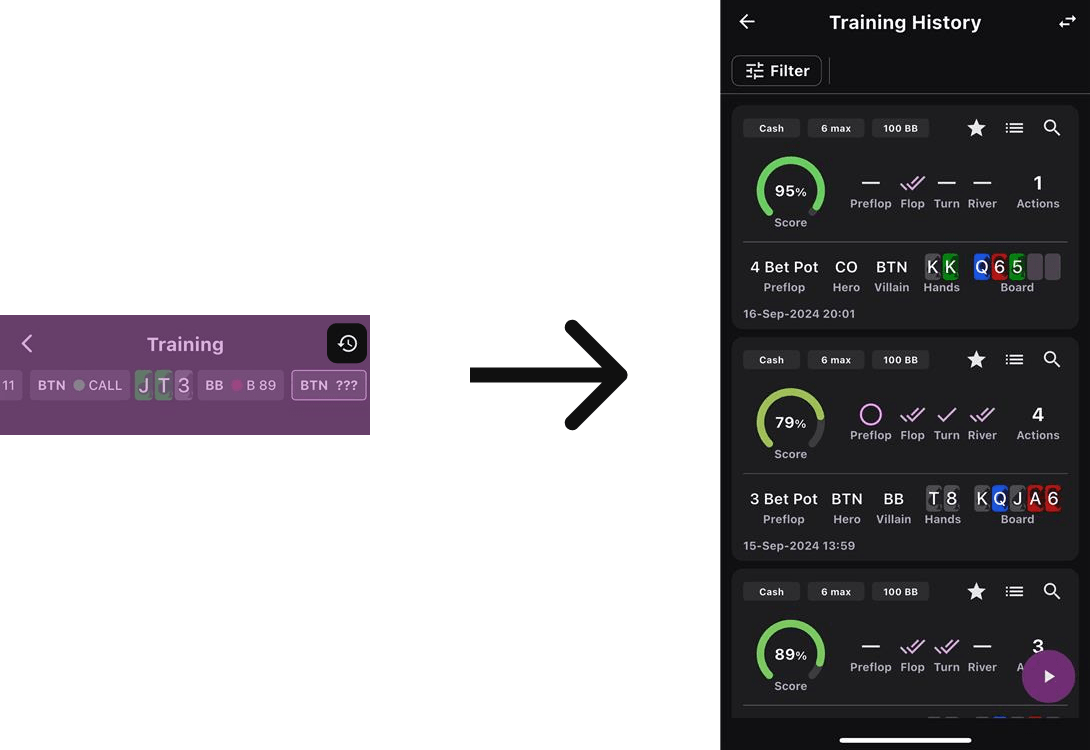
In Training History, you can view the results of your training in two different UIs. This allows you to check your history in the optimal format according to your needs and situation.
You can view two different formats: “Play List,” which shows a detailed play history for each street, and “Situation List,” which is summarized based on specific scenarios.
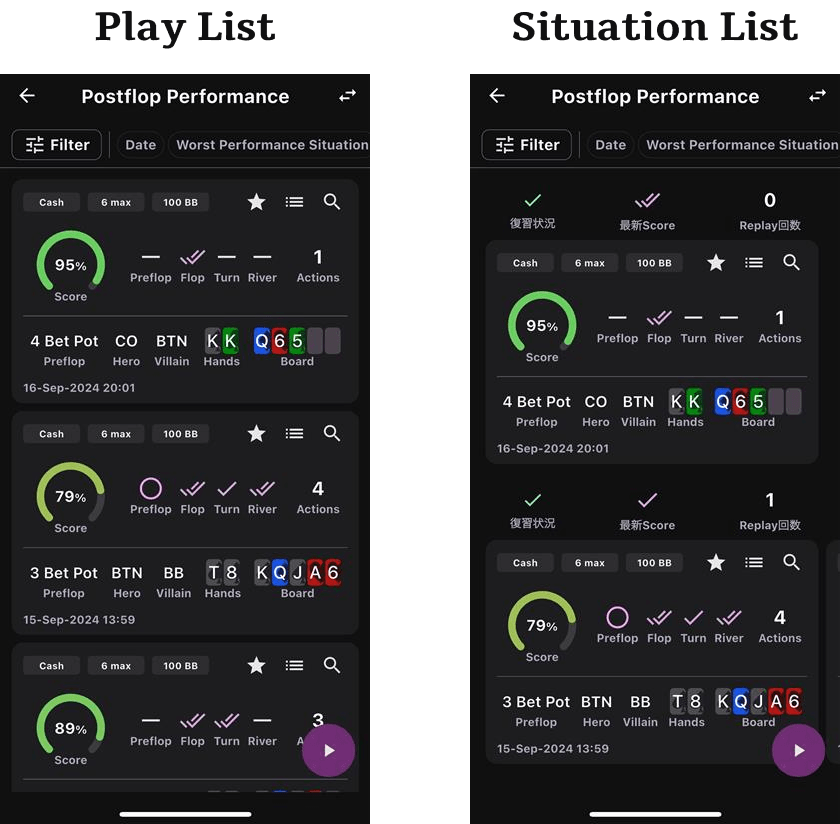
Play List History
In the Play List, detailed training histories are displayed for each street. If you replay the same scenario or use “Play as Hero” from the play history at the top of the training screen after training ends, each replay is saved as a separate entry in the Play List. For details on the history cards, see here.
This UI is recommended when you want to review the same history multiple times and check past mistakes.
Situation List History
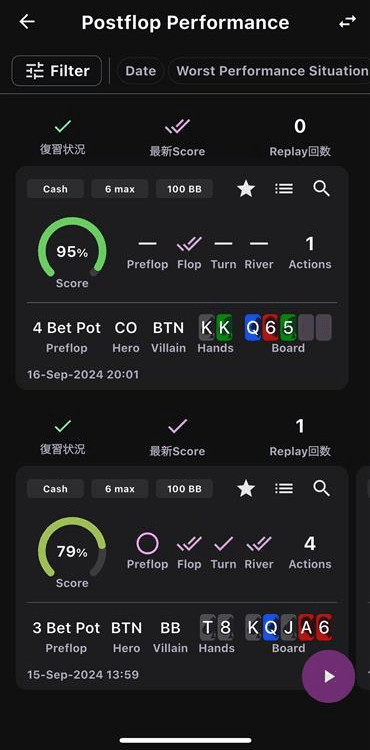
In the Situation List, training histories are gathered and displayed according to specific scenarios. If you replay the same scenario or use “Play as Hero” from the play history at the top of the training screen after training ends, those replays are considered multiple replays within the same scenario and recorded as such. This is especially useful when you want to check whether your training has been reviewed or how many times it has been replayed.
Training Status
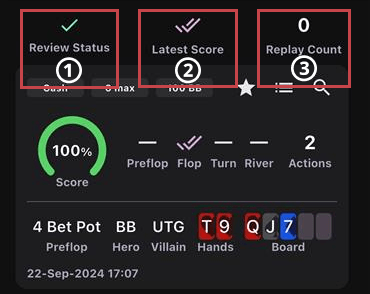
① Review Status
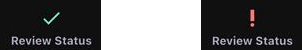
You can see whether each training history requires review. This feature shows which histories need review. The right icon indicates that review is required, and the left icon indicates it is not.
The rule for review depends on whether an action had a 0% frequency preflop, or if the overall Score was 60% or lower postflop. When you replay these histories and the situation no longer requires review, the review status is updated.
② Latest Score
Shows the most recent Score for that scenario. For details on Score, see here.
③ Number of Replays
Shows how many times you’ve trained in that scenario. This serves as a reference for how much time you’ve spent on a specific play and whether it was effective.
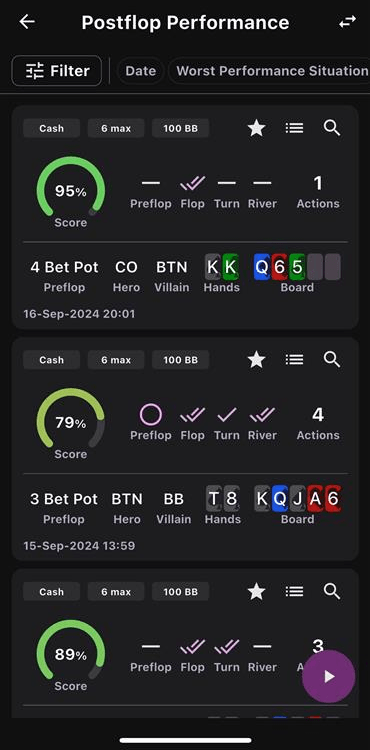
Common Display Items
Training History Cards
• Replay
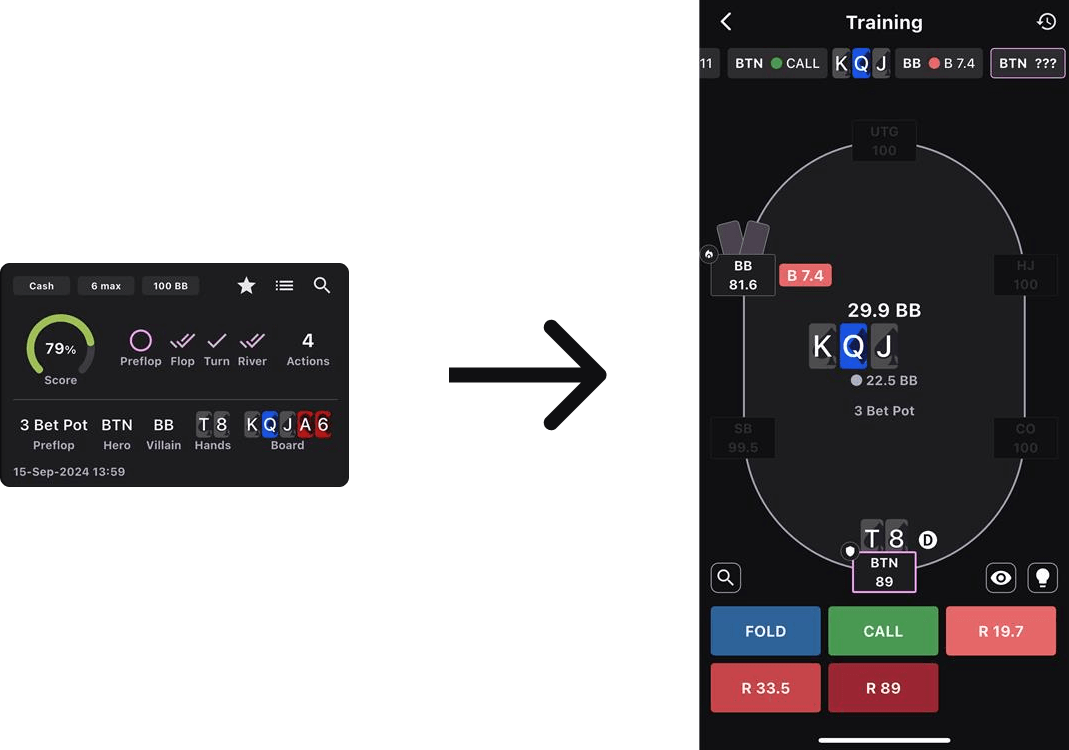
You can tap a play history to retrain it.
• Favorite Icon
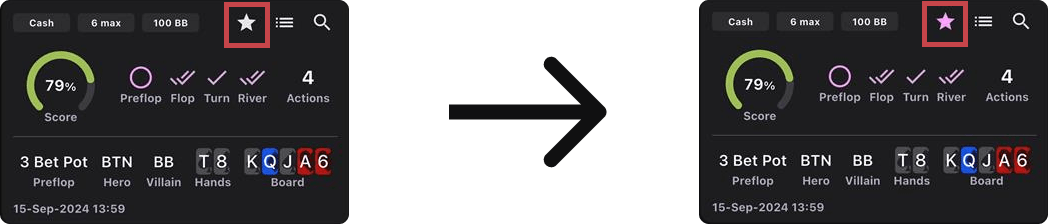
You can mark specific histories as favorites, allowing you to revisit or save them for later review.
• Play History Icon
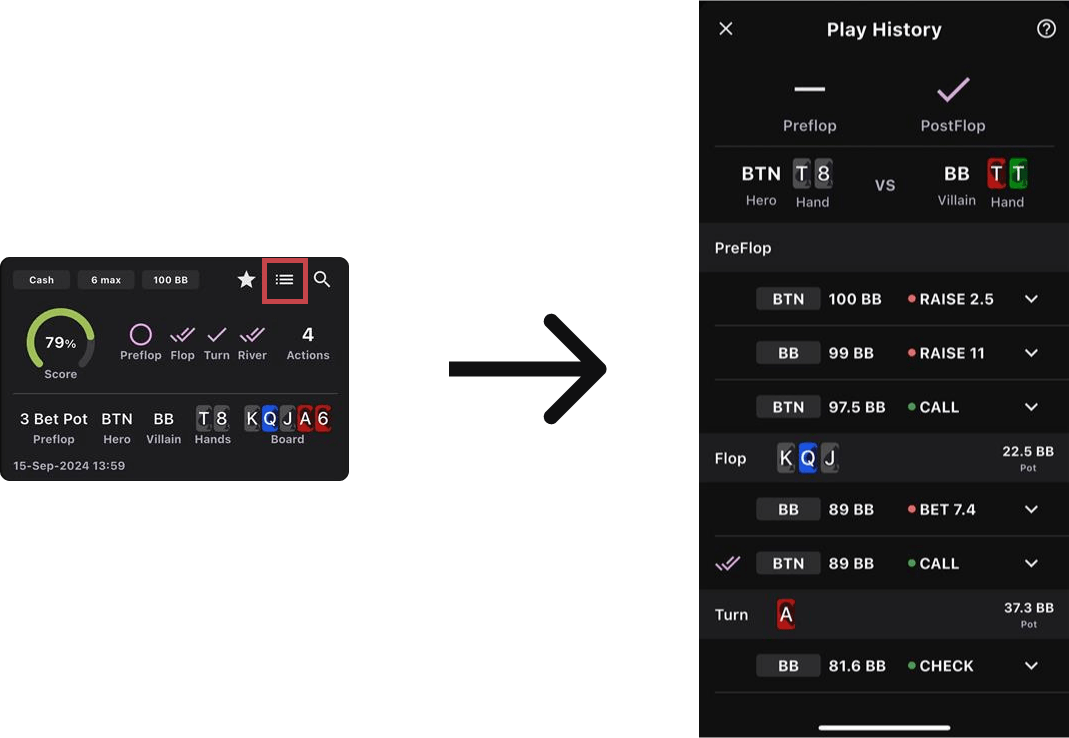
You can view detailed information on the play history you are currently viewing. For details on play history, see here.
• Magnifying Glass Icon
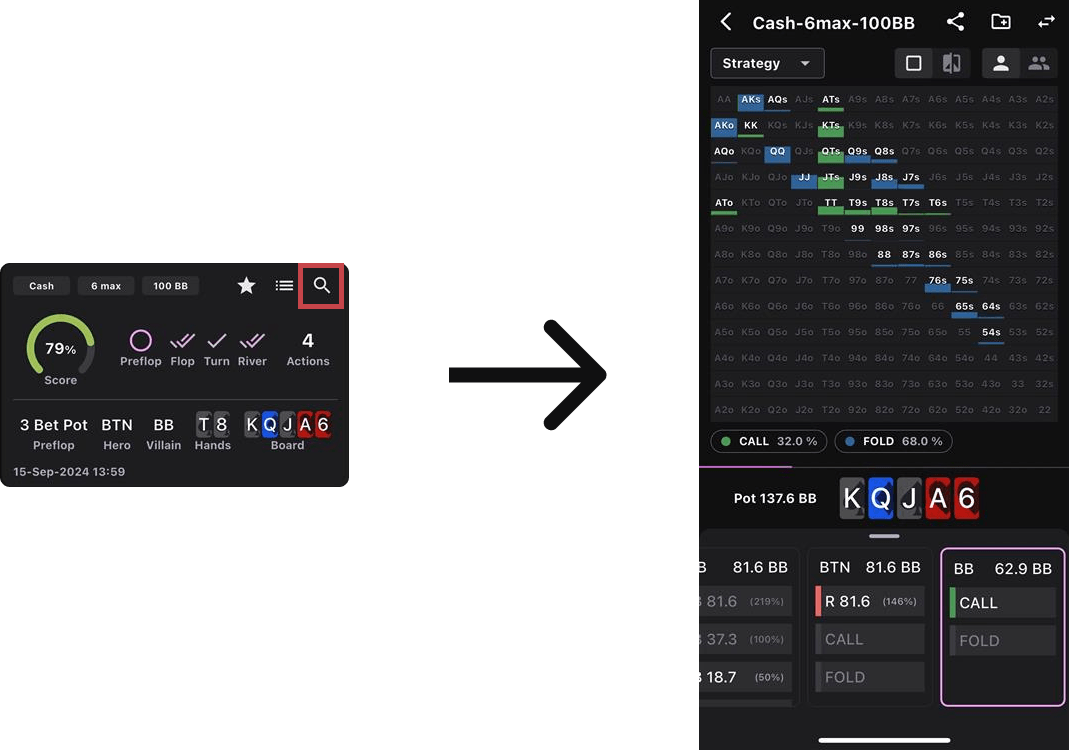
You can see GTO analysis for the current history. For more details on GTO analysis, see here.
Random Replay
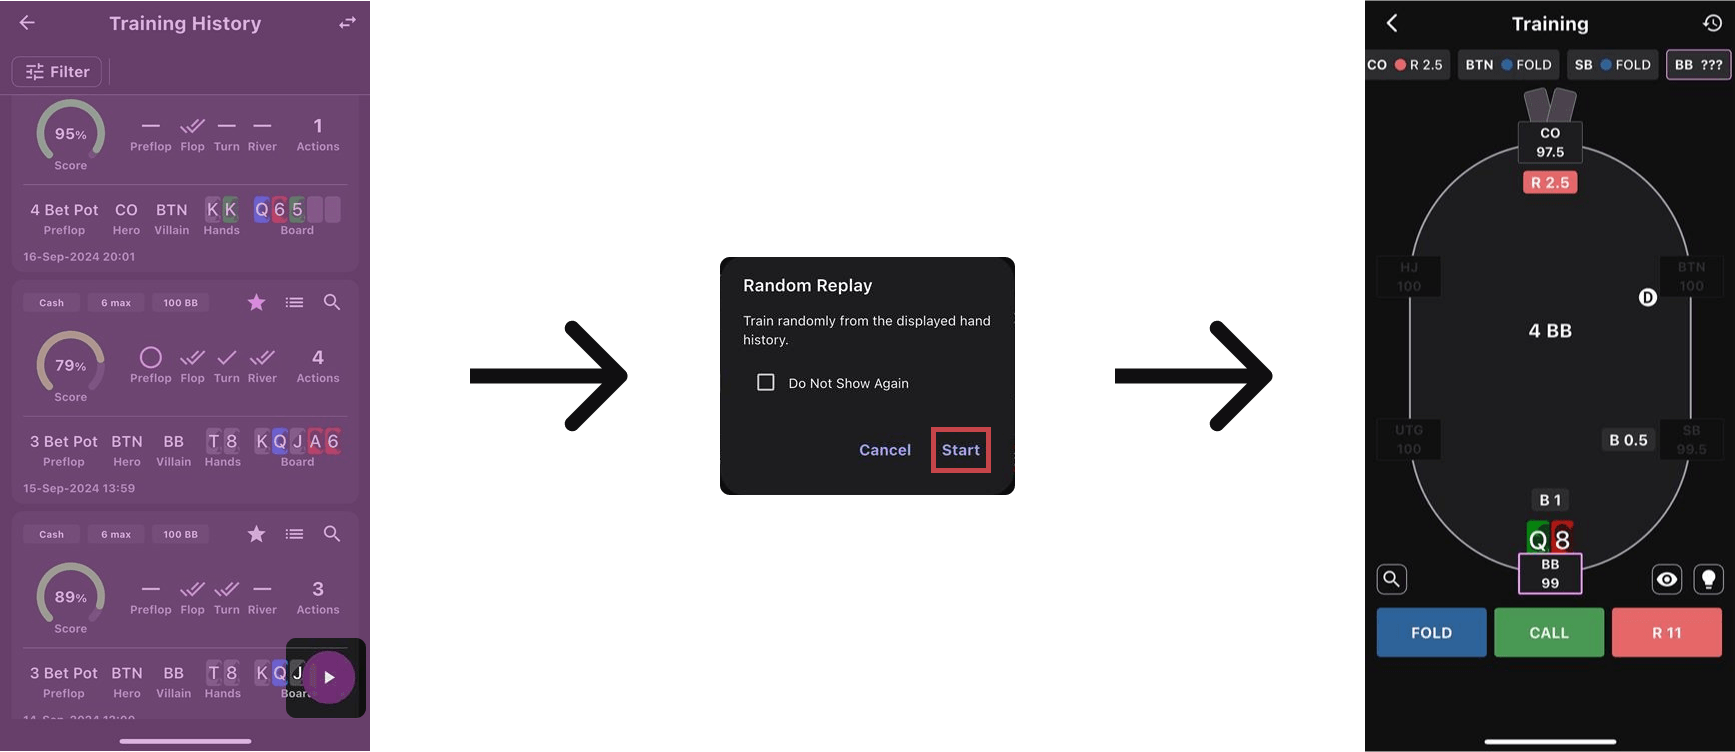
By tapping the button at the bottom of the screen, you can randomly retrain the currently displayed histories. If you filter for histories with low Scores or those needing review, you can sequentially train them, helping you review scenarios where you struggle.
Filtering
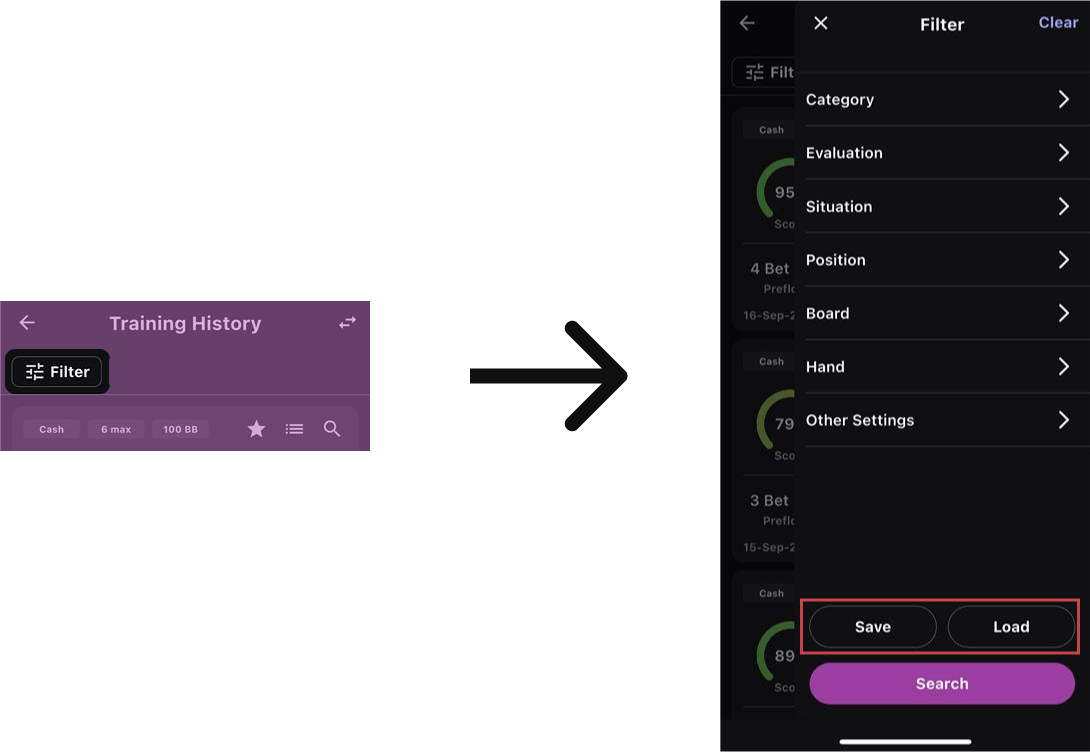
When displaying histories, you can filter them based on certain criteria, such as time period, specific scenarios, favorites, or specific performance metrics.
• Saving and Loading Filter Settings
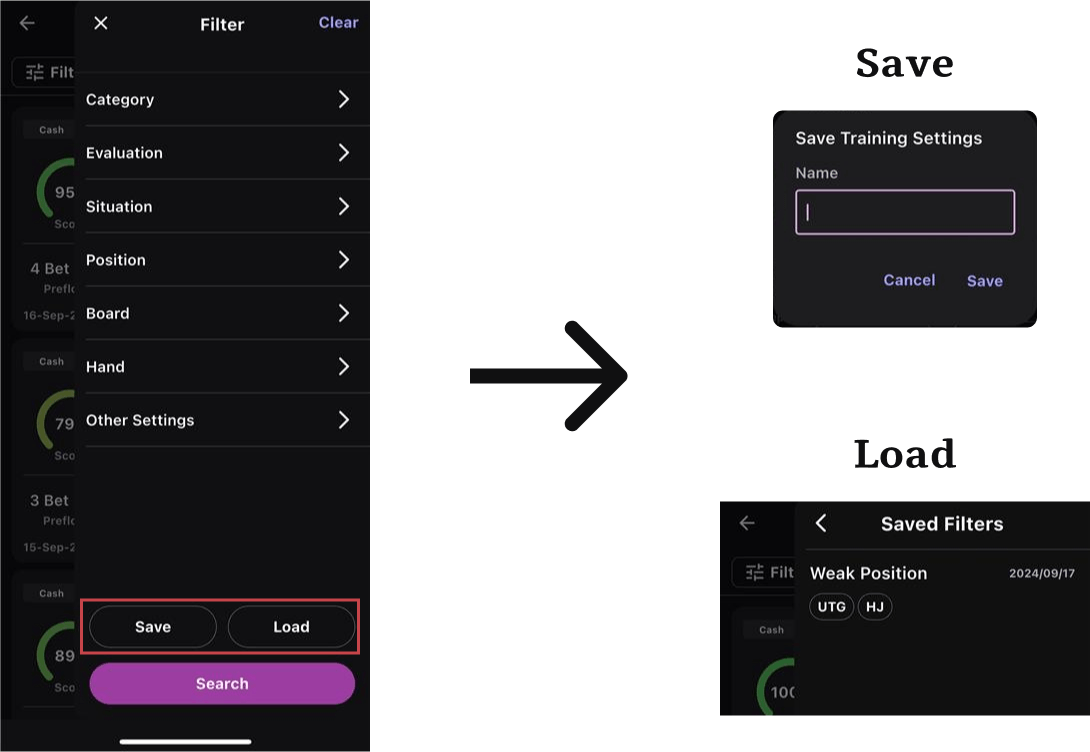
You can save any filter criteria under a chosen name. Be sure to save frequently used conditions.
Performance Management
NTPoker’s performance management feature allows you to analyze your training history in detail and identify which parts of your play align with GTO and which parts need improvement. Performance management is separated into Postflop and Preflop.
Preflop: Analyzed based on whether the chosen action has a GTO frequency. Postflop: Primarily analyzed based on your Score.
• Score
| Display Element | Description |
|---|---|
|
| No EV Loss has occurred; a correct action according to GTO |
|
| The selected GTO frequency is extremely low, and EV Loss has occurred |
|
| Significant EV Loss occurred and needs improvement |
|
| Significant EV Loss occurred and needs improvement |
|
| A critical mistake led to very large EV Loss |


Frequent Filter Conditions
Commonly used filter items are listed at the top, and you can tap them to filter by those predefined conditions.
For example, tapping “Your Most Challenging Situations” filters for the worst performance conditions in terms of preflop end states, position, board, and hand.
To dive deeper into analysis, actively make use of the filter function. For more details on saving and loading filters, see here.
Training History
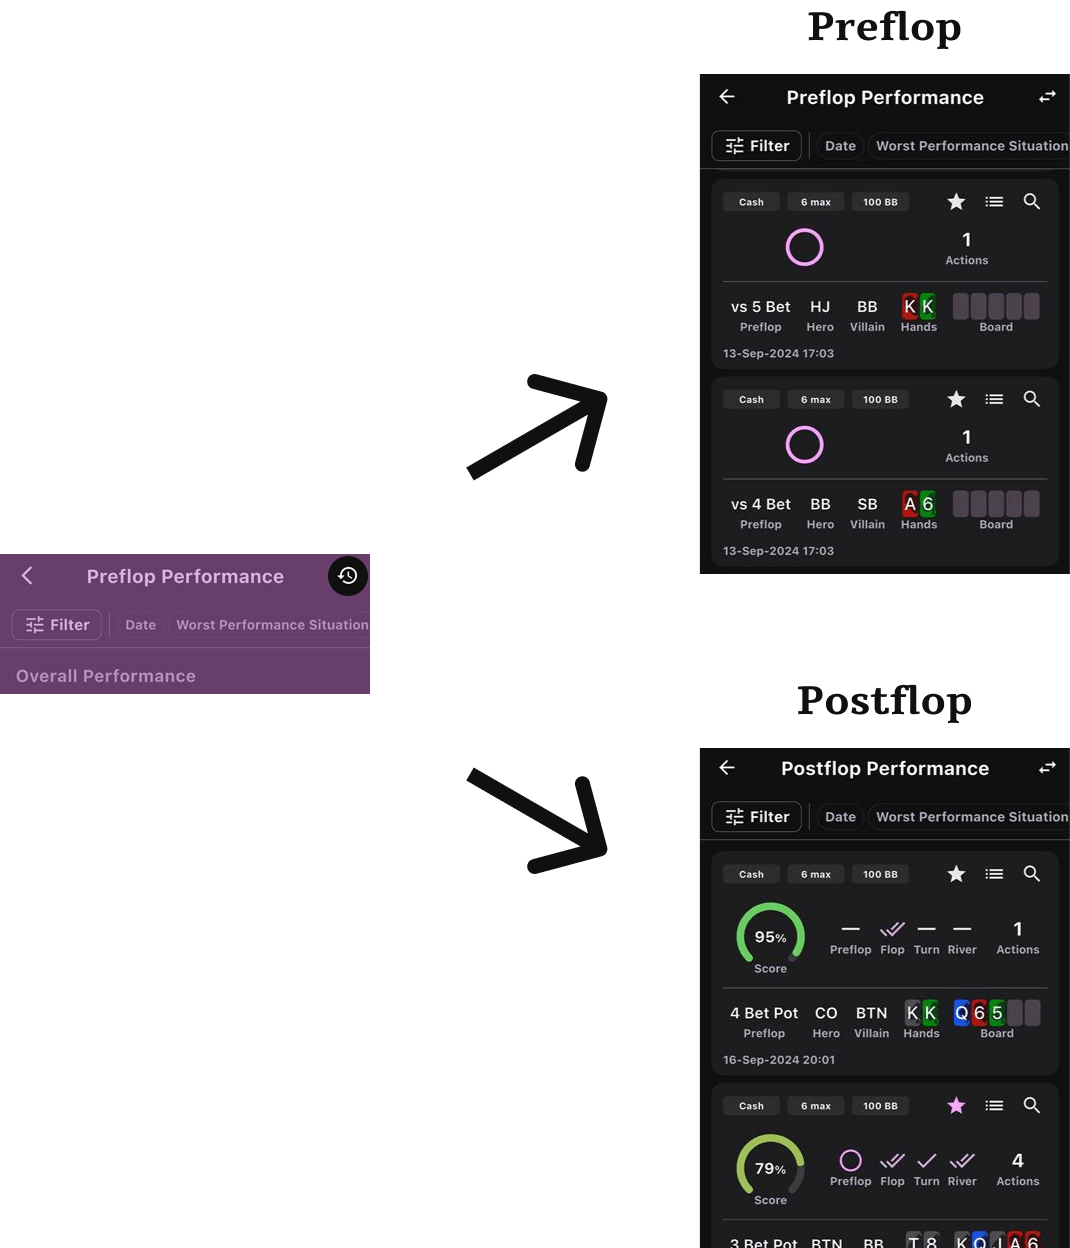
From each Preflop and Postflop performance management screen, you can view the training histories used to calculate the currently displayed analytics. Past performance histories are arranged chronologically, allowing you to reflect on your progress. Conversely, if you apply filters on the history screen, those same filters carry over to performance management.
This historical data is an important resource for determining how you’re improving and identifying areas that need more work.
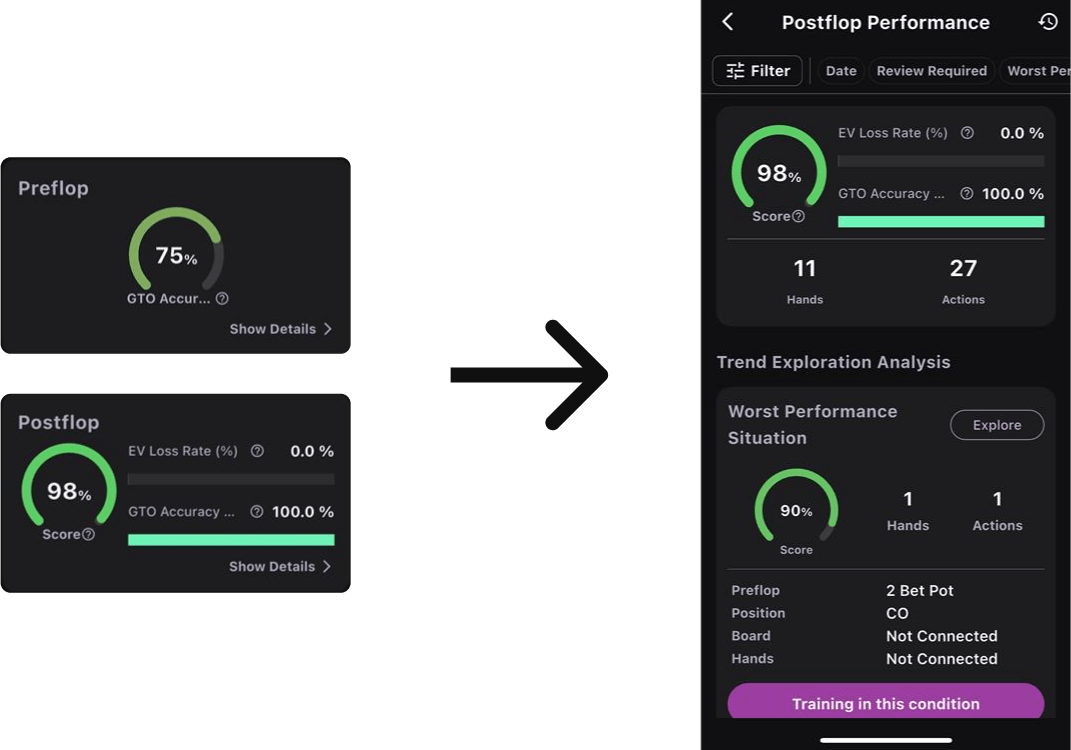
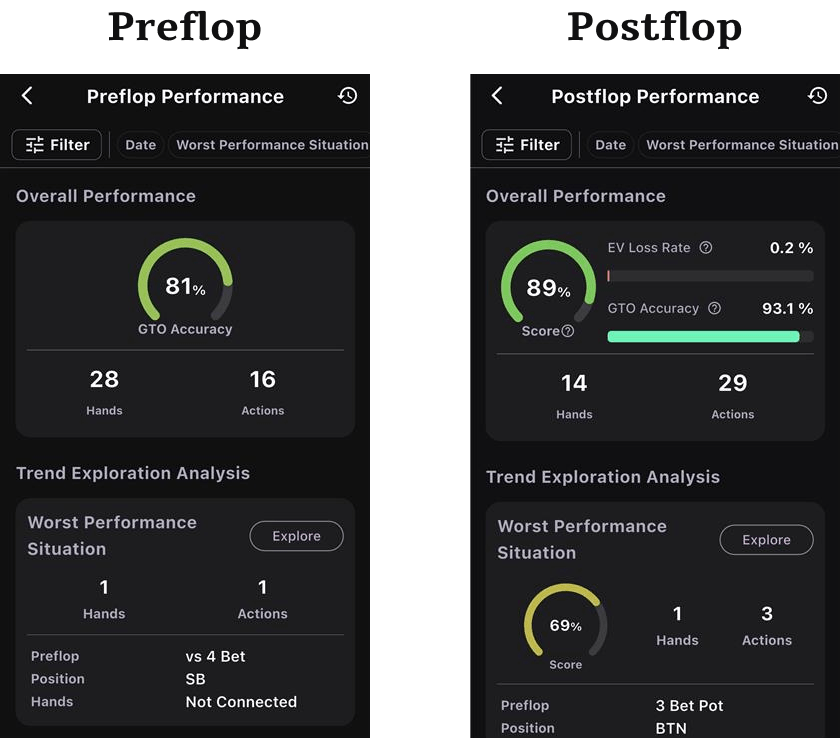
Overall Performance
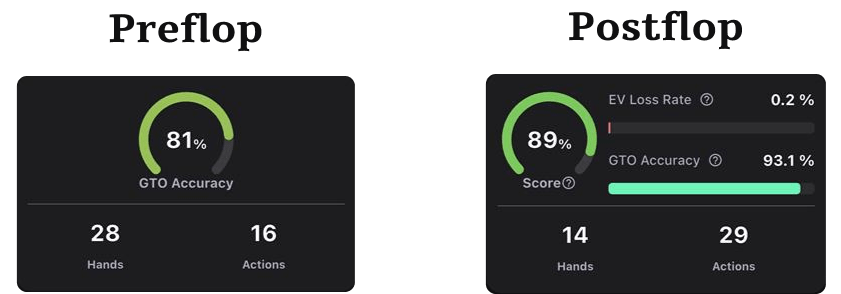
Overall Performance aggregates your training results, displaying them visually so you can see your performance at a glance. For Postflop, you can view Score, GTO Accuracy Rate, and EV Loss Rate.
Trend Exploration Analysis
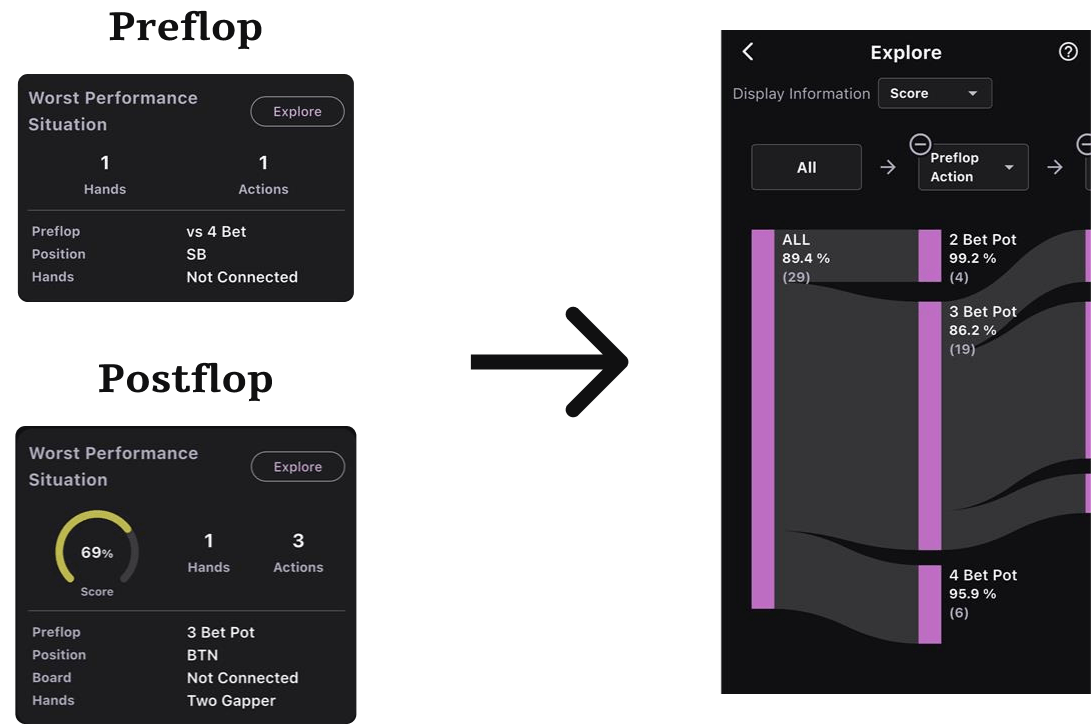
Trend Exploration Analysis lets you discover situations where you’re weak or strong using specific evaluation metrics. For preflop, a common metric is the GTO Accuracy Rate; for postflop, the Score is typically used.
You can define any element—such as position or board—as your evaluation axis and compare performance across these elements.
For instance, if you use Score as the metric and Position as the element, you can compare the Scores for each position and find the one with the lowest Score.
Additionally, you can layer these elements in stages.
For example, after identifying a position with a particularly low Score, you can then find which hands in that position have especially low Scores. Digging deeper this way allows you to explore your play tendencies using various elements.
• Node Display Information
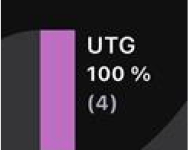
Node display information lists, from top to bottom: element name, display metric (Score, GTO Accuracy Rate, EV Loss Rate), and number of actions. By tapping a node, you can explore it further. Using this feature helps you pinpoint your most challenging or strongest situations.
• Adding, Deleting, and Changing Elements
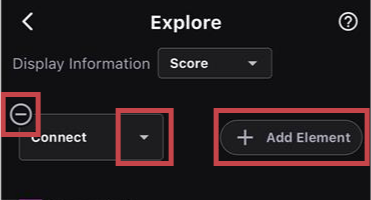
By tapping each red box, you can add, remove, or modify the elements you want to view.
• Changing Display Information
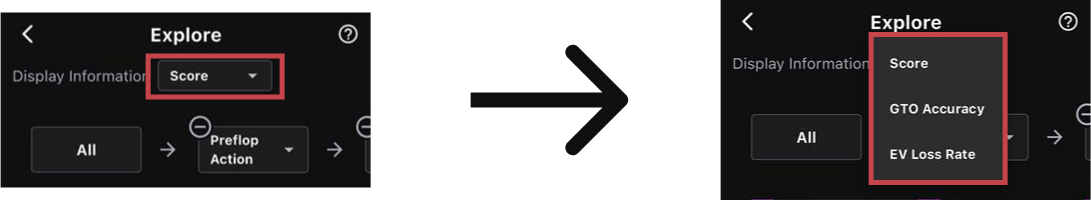
In preflop, only the GTO Accuracy Rate is available. In postflop, you can change between Score, GTO Accuracy Rate, and EV Loss Rate from the dropdown.
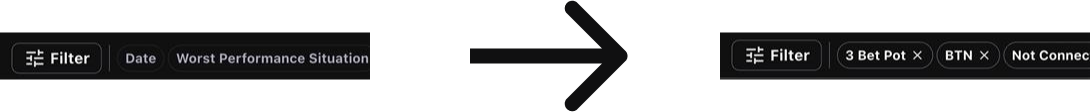
• Adding to Filters
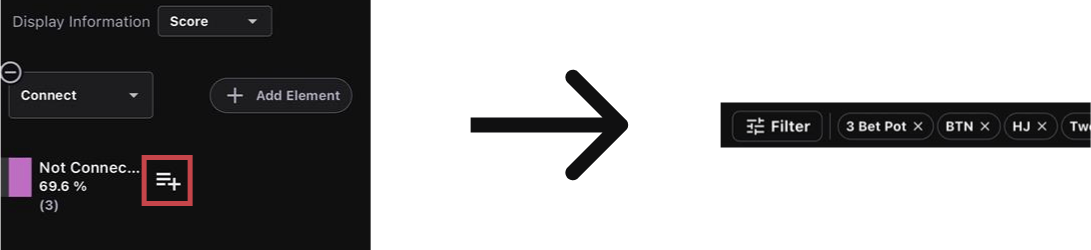
By tapping the plus icon on the far right of a discovered situation, you can add all items for the selected elements to your filters.
Trend Analysis
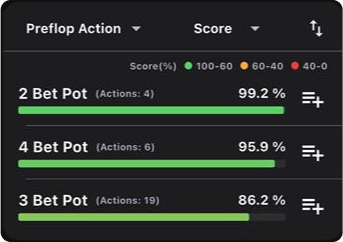
In Trend Analysis, you can select an element as your evaluation axis and compare metrics for each element. These elements can include training conditions such as position or board.
In the example image, the Score is displayed by each preflop action element.
• Element Display Information
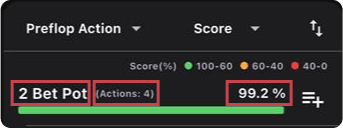
From left to right, the element display shows element name, number of actions, and the chosen display metric (Score, GTO Accuracy Rate, EV Loss Rate).
• Changing the Element
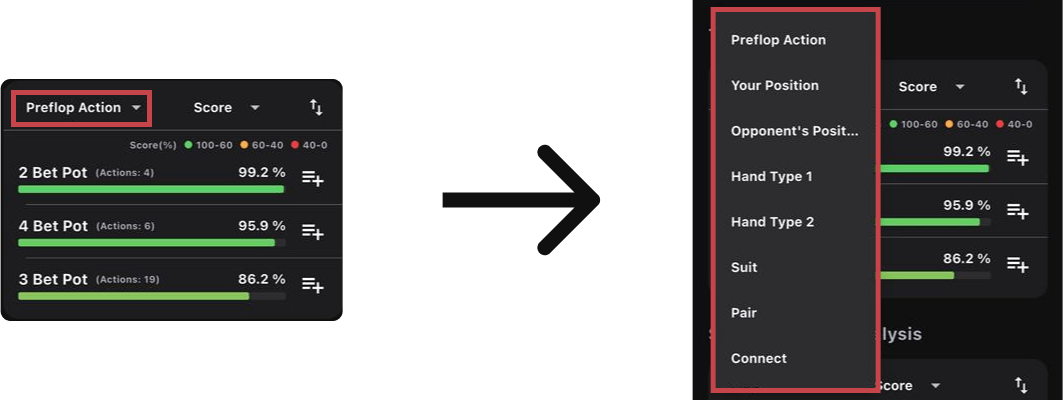
You can change the element from the dropdown.
• Changing the Display Information
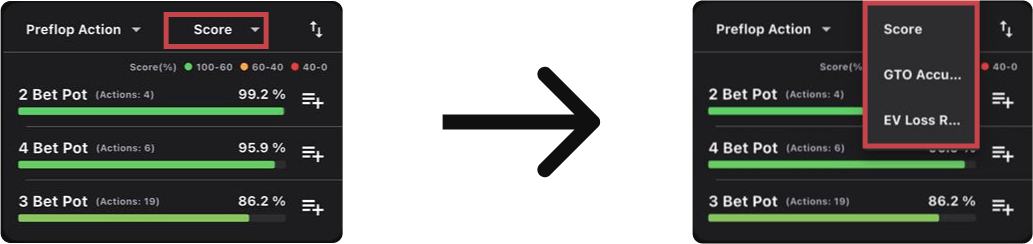
You can change the display metric from the dropdown.
• Adding to Filters
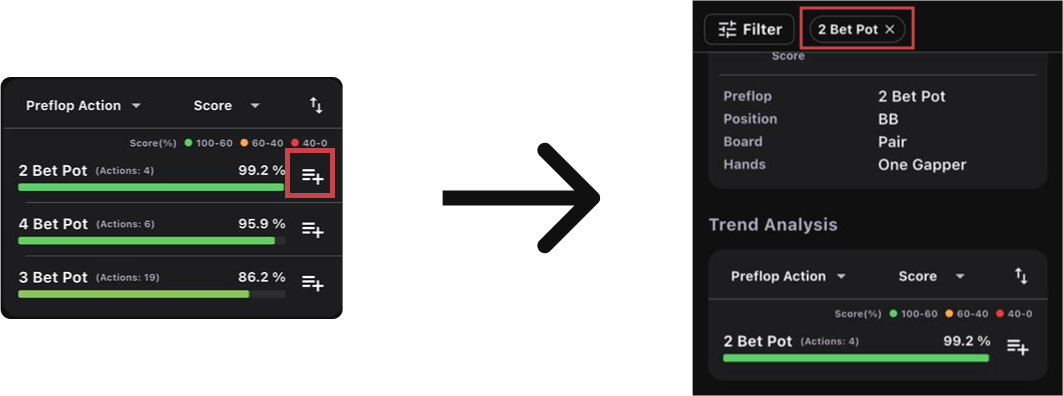
Tapping the icon in the red box adds that item to your filters.
Situation Trend Analysis
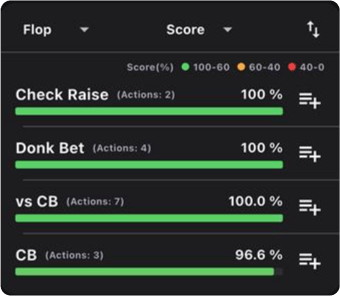
Situation Trend Analysis allows you to compare performance in specific scenarios. These scenarios refer to representative actions like Check Raise or Donk Bet that can occur, and you can change them by selecting different rounds from the dropdown.
By default, Score is used as the evaluation metric, but you can change it as well. The basic operations are the same as in Trend Analysis.
Action-Based Trend Analysis
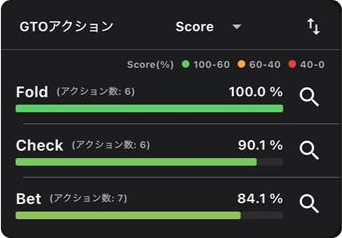
In Action-Based Trend Analysis, you can view your performance by action, allowing you to check for action-related patterns.
Note that the displayed actions are not necessarily those you took but are rather the most frequent actions according to the GTO strategy in the situations you trained. For example, with “Call,” you can check whether you correctly made the call in the spots where GTO strategy suggests a call.
This lets you determine which actions you are not consistently choosing correctly. Each action has a magnifying glass icon for more detailed information.
Magnifying Glass Icon
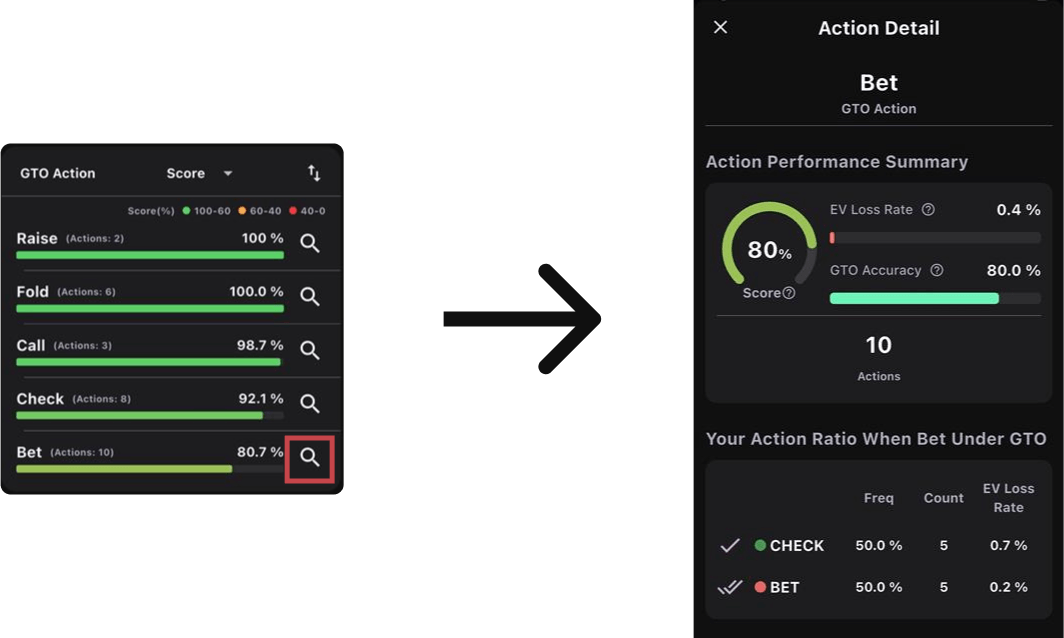
Each analysis screen has a magnifying glass icon that, when tapped, displays more detailed analysis results.
You can check which action you actually took in situations where GTO suggests a certain action. If you selected an action different from GTO, you can see details such as how much EV Loss resulted from that decision.